|
|
| Разместил (Author): |
SergUA6  |
|
|
Текст
|
The Updating of SA to 6.0.4.4 version:
Generally some minor problems are detected and fixed. PhasePlane module is modified. It is possible to load the function of graphical output of the spectrum much better, because the precise measurement of the frequency is possible directly on the sonogram. There would be not much of sense, but there are undeniable advantages of the graphics in some situations. In the general case, Graphics are not a panacea, but they are essentially expand and intensify the position of SA as an analyzer.
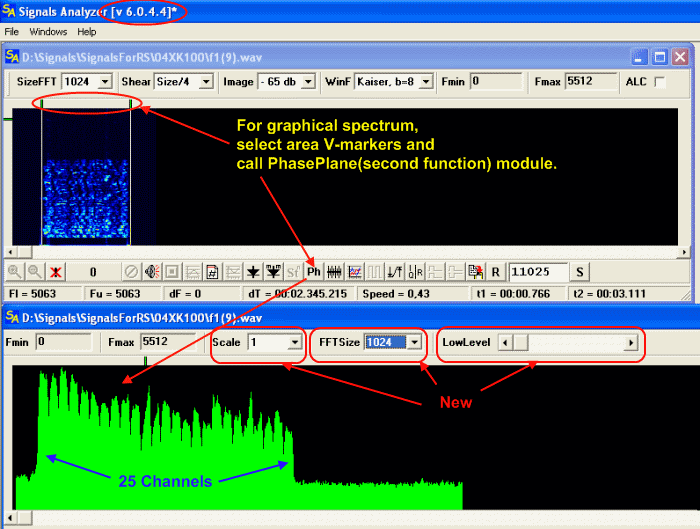
Added abilities:
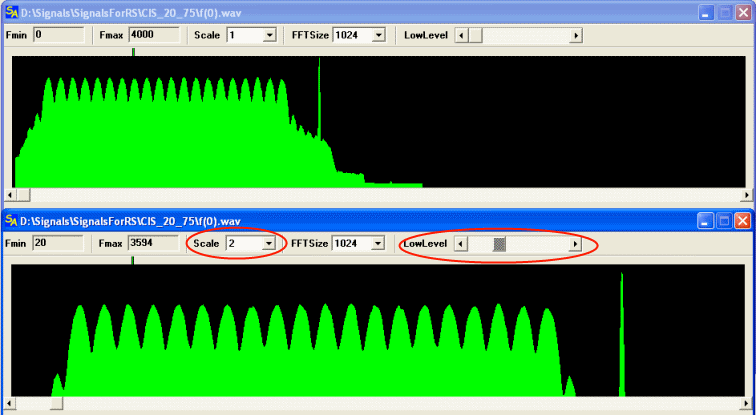
Scale - scale horizontally upwards.
FFTSize – the size of FFT block. The graphic is building by these blocks.
LowLevel – the lower verge of the level, which is reflected, while displacement of the slider to the right side. The verge is going upwards, but because the graphic’s maximum amplitude is holding on the permanent level, it does look like “withdrawal” of more weak components from the field of vision, with synchronous vertical increasing of the resolution.
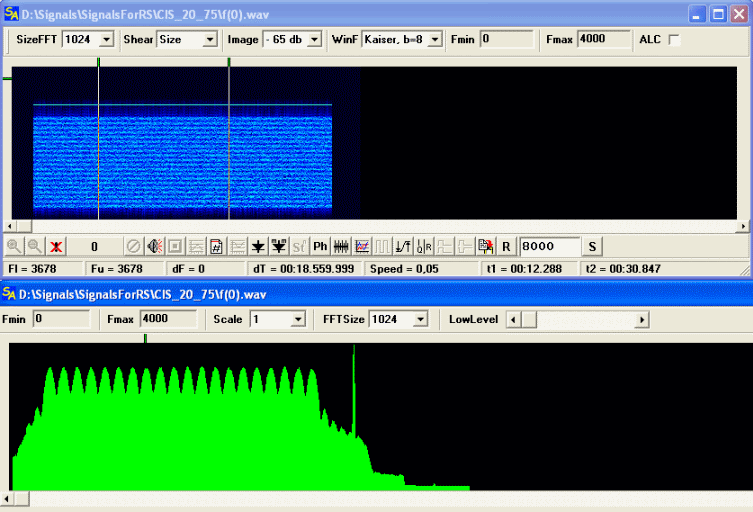
All the examples are taken from site’s database Base of signals:
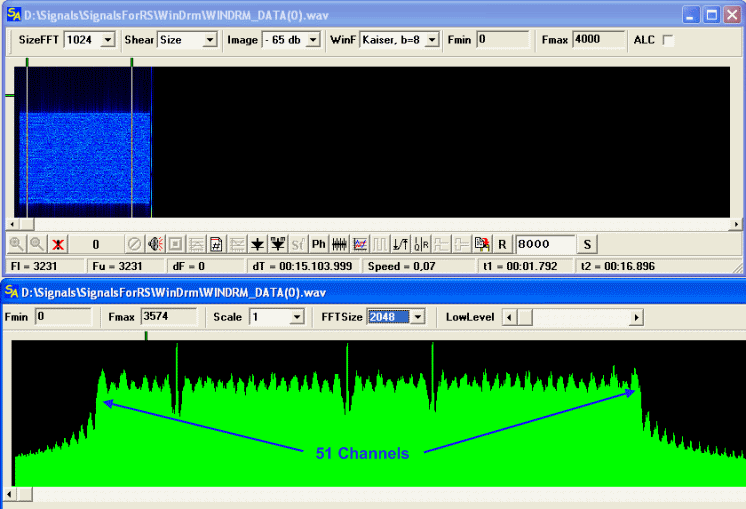
Please, pay attention, that the number of the frequencies and pilot-tones are easily defining, therefore, the graphic is more clear, then the sonogram, thanks to averaging-out.
The example of the LowLevel and the Scale using.
Like any tool the graphic has its pluses and minuses. The pluses are: strong averaging-out and visualization of the details, which are quite hardly noticeable on the sonogram. The minuses are: Because the averaging-out is realizing on the sizable time-fragment, then in case of the unstable frequencies, or smoothly changing frequencies, the high-quality visualization is impossible.
It is always search for compromises in practice: desire to get both high-quality detailed elaboration and good averaging-out, while both of them are alternative. But the SA, in the most of cases, gives an ability to get quite good results, owing to the combination of Scale, FFTSize and LowLevel.
***
The Updating of SA to 6.0.4.6 version:
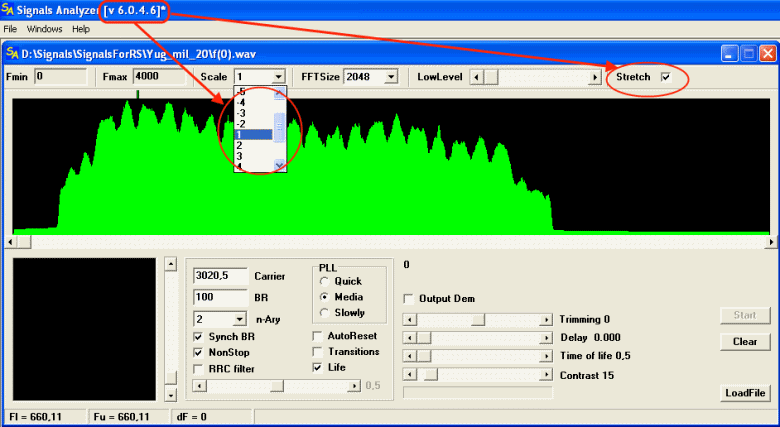
Except the ability to increase the scale, the ability to decrease the scale was added. Negative values of the Scale field were added. Stretch item was added – owing to Stretch, whole image is represented in the window. Sometimes it is very useful. This option is turned ON by default.
The algorithm of work of the Measurement of Freq function is changed, the exact measurement of the frequency by the sonogram. Almost nothing changed for user, but all delays are reduced to minimum. In the most of cases delays do not exceed 2 second, and 4-5 seconds in the worst cases. And the most important thing: If someone had seen the “Out of memory” message already (two persons had reported me about this bag/problem), then you can forget about it, because this bag was fixed/removed in this update.
Good Luck!
|
|
|
|
Добавлять комментарии могут только зарегистрированные, активировавшие регистрацию и не ограниченные в доступе участники сайта!
|
| Файл создан: 17 Apr 2009 18:41, посл. исправление: 17 Apr 2009 23:57 |
|

