|
|
| Разместил (Author): |
SergUA6  |
| Авторские права |
© http://www.radioscanner.ru |
|
|
Текст
|
The overview article (manual/guide) about the analysis of various OFDM signals in SA versions v 6.2.4.4
It is supposed that the reader is familiar both with basics of OFDM technology and with our previous articles:
SA - OFDM module detailed tutorial.
SA - work with OFDM module
SA - OFDM module, constellations in channels.
SA - how to work with OFDM module. Examples.
SA - Parameters of OFDM signals.
SA - OFDM analysis in SA version 6.2.3.3
And etc...
The general ideology and terminology remain former.
Let's consider bases and new possibilities of current version SA 6.2.4.4 on examples of analysis several OFDM signals.
The record. WinDrm .
This signal was being selected as the start example for the several reasons.
In the first: We will show that k = (LG/LU) or k = ((Sh/Br) - 1) really is the "magic" constant, which unambiguously characterizes a core of formation of any OFDM signal with CP.
In the second: This signal has mass of various service channels/symbols, to find out which earlier was simply impossible.
In the third the signal is well-known, and all conclusions can be checked up. That is, we don't insist to believe only in the words, on the contrary there is the full possibility to check up operation OFDM analyzer in SA.
Let's go!. :-)
Here are some standard actions:
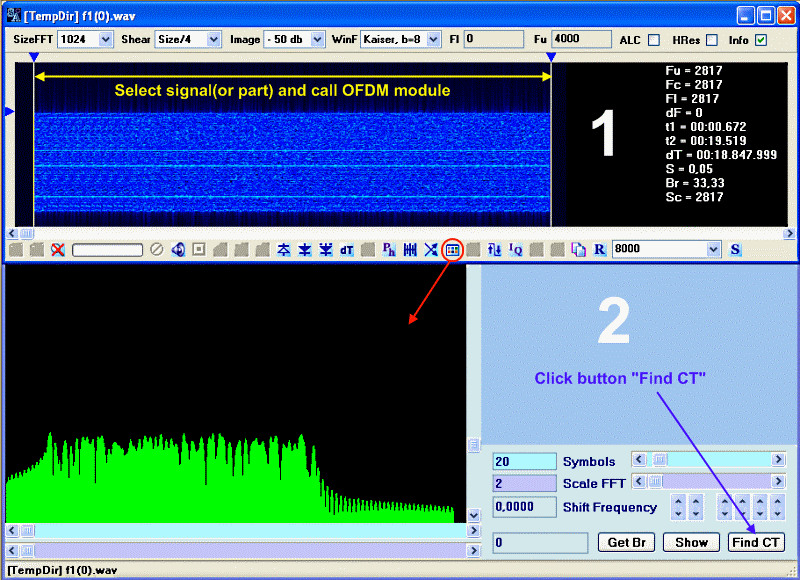
Step 1. To select a fragment of the signal or whole signal. and to call OFDM module.
Typical error which admit very many. It concerns not only analysis OFDM of signals:
- A neglect to sampling rate of the record. In our example sampling rate is quite reasonable - 8000 Hz. But the overwhelming majority of records possess absolutely superfluous SR in 22050 Hz, 44100 Hz, 48000 Hz etc. It is always necessary to result value SR in the optimal. Optimal value of sampling rate for the analysis is sampling rate within limits BW * (2.5-4), where BW width of a spectrum of a researched signal. Higher values SR, are absolutely superfluous and should be well-founded. If there are no such substantiations, then sampling rate should be reduced by SA means. SA possesses qualitative oversampling system, and usage of outer/indirect resamplers isn't recommended, in order to avoid uncontrollable quality degradation of a signal.
Step 2. After call OFDM module, the process of search of the correlative triangle is launched by the button "Find CT". It is necessary to do nothing on this stage. On the overwhelming majority of signals, the last record in an output/display window of results will be correctly representing the facts/reality. Important! It is only the rough data, just because I is hard to find anything better on this stage, from the point of view of the program certainly.
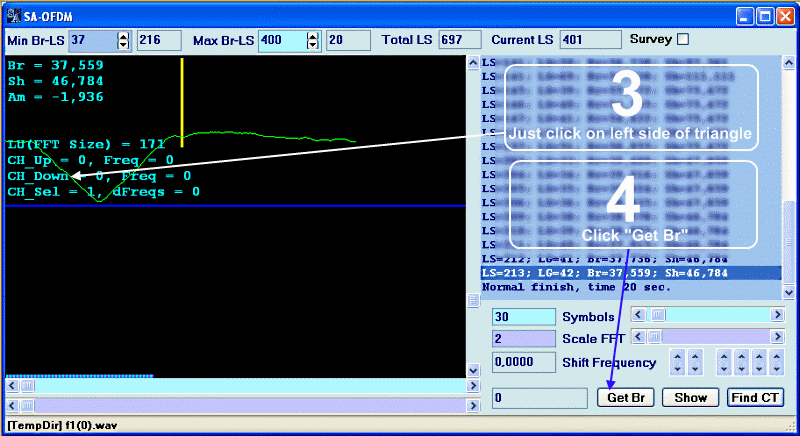
Step 3. Click on the left ("good") side of the correlative triangle, we are putting it in an optimal position. It doesn’t matter if the triangle will be positive or negative. It is not necessary to undertake and adjust anything in this plan!
Step 4. Now we call "Get Br" function. The tasks of this function are:
- Obtaining of exact value Br.
- Signal positioning on frequency. Positioning on frequency, automatically will translate the triangle in the positive polarity if it was negative.
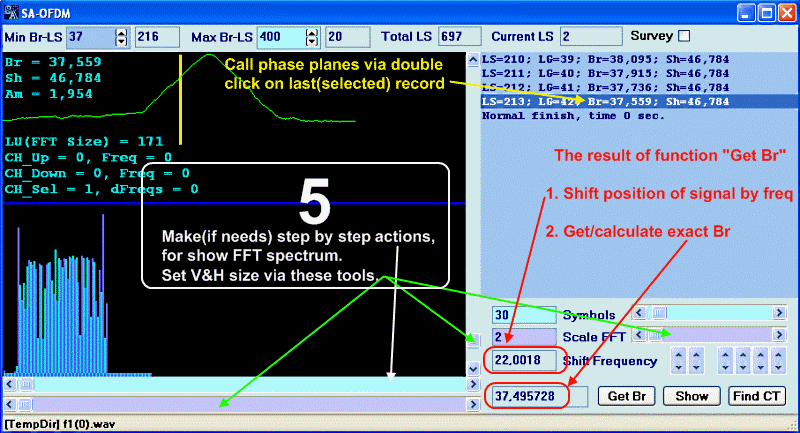
Step 5. If it is necessary we should make some symbol-by-symbol steps, before spectrum appearance in the window. Probably in the beginning, at the signal transmission into OFDM module, small piece without the signal has been captured.
Switching-on of display of phase planes, through double cliques on the last (selected) record.
Scaling and positioning of FFT spectrum.
And a good occasion to look attentively at what generally has turned out. :)
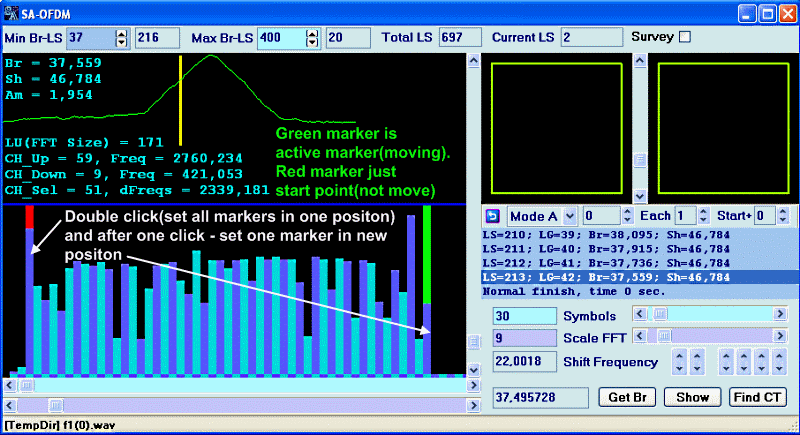
At this stage if all has gone regularly, we have:
- Exact (in reasonable limits certainly) value Br = 37,495728 Hz.
- An amount of channels and their allocation on current symbol = 51.
- Necessary offset/shift/displacement of the signal on frequency in an optimal position = + 22,0018 Hz from position of the signal in the record. This offset/shift although is close to the real, but it is still approximate. Anyway the relation to this value should be careful.
- LU = 171 samples
- LG = 42 sapmles and accordingly LS = LU+LG = 213 samples.
Important! These are absolutely not are guaranteed values LU and LG, in sense of their relation to the signal. These are abstract enough values and there should be skepticall relation concerning these values until warranties will be received.
As we see, despite absence of warranties by many criteria, already on this step we know a lot enough about the signal.
It is possible to "walk" on the signal symbol-by-symbol, and to note that the extreme (the first and the last) channels have identical amplitude on every third symbol.
It is possible to pay attention that in a manual mode "triangle" intensively enough leaves from the marker, and it means that sampling rate 8000 of Hz which is not suitable for the analysis/demodulation of this signal.
It is possible to launch the mode of dynamic mapping of constellations, and to pay attention that three pilots-tones are marked out very well on the general background, and the absolute constellation is rotating.
It is possible to synchronize a point on pilot-tone, and try to consider the constellations in the channels near to pilot-tone, etc.
SA possess very many possibilities.
We approach to the main thing. :)
Exact value k for this signal is equally 0.25 or 1/4. It means, we can easily receive all necessary for the signal to give it an appropriate look.
In OCG we receive list LU and LG for this value k = 0.25 and current amount of channels = 51.
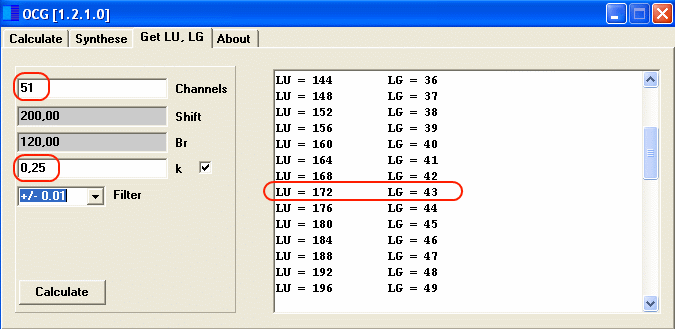
It is possible to select any pair of values LU and LG, all of them are correct and guarantee the correct result. We will select LU = 172, LG = 43.
Then:
- LS = 172+43 = 215 samples.
- Speed of manipulation received in SA for this signal = 37.495728 Hz. Hence sampling rate on which the signal should be analyzed/demodulated is equal 215*37.495728 = 8061.58152 Hz.
We approximate it to 8062 Hz as fractional values are not processed.
We are closing current session in SA, and repeat all the steps on this record, but beforehand resample it on frequency 8062 Hz.
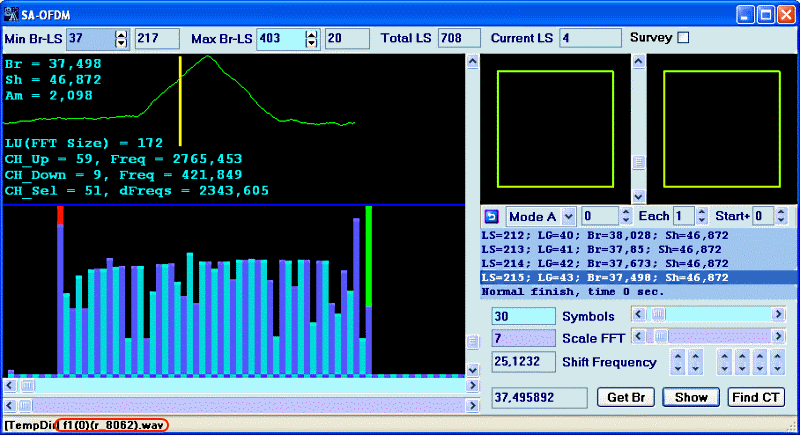
Compare values from the first variant obtained earlier.
The relative error of determination Br is less than 0.0005 %. It is very good accuracy, and it speaks about reliable enough value of this parameter.
Optimal shift of the signal is another now, though it is rather close to the one, which had been received earlier. But anyway it is value approximate.
But... LU and LG are precisely correspond to the true ones now! Now they are not the abstract values, but the exact values having a direct relation to the signal.
Now we can work in much more comfortable conditions, as actually we are situated strictly within the limits of legal/correct parameters of the signal, and we have only one error, it is the sampling rate error, which is connected with approximation. It makes less than 0.5 Hertzs. However we are precisely know that all other parameters are known precisely enough and it is very essential plus.
Ok. We are moving further.
Earlier we has been talking that on extreme (on the first and last) channels periodicity in three characters is noticeable. The current version of the analyzer allows to check up it easily.
We are launching the mode of dynamic mapping of constellations. We are exposing/specifying value "Each" = 3, and selecting offset/shift "Start +", thus we get such picture/image. At me it has happened at start offset/shifting on 1 symbol. You can have other value in the range from 0 to 2.
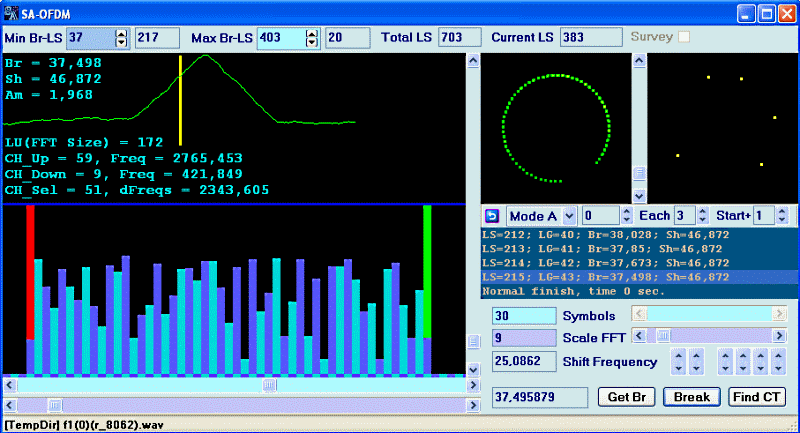
Now we need only to synchronize an absolute constellation, through the signal shift by frequency, there are no other methods in SA yet.
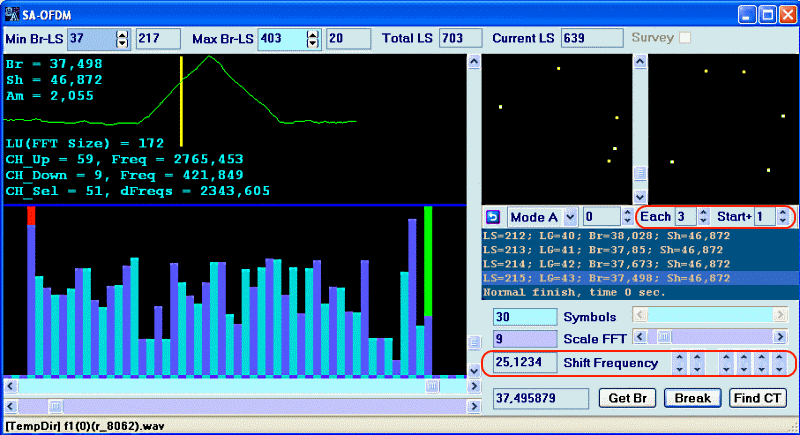
Not so bad result, truly? :)
Within the limits of the general analysis of signal WinDrm it is known, that its ACF it is equal 400 msec. It makes 15 symbols. It is logical to assume, that there are some service sequences on these 15 symbols in various.
Actually, structure of the signal and constellations of WinDrm is rather interesting and difficult enough. We leave possibility to realize detailed researches independently, but we will show one more interesting moment. Don't forget that an exact setup of the signal shift by the frequency at the channel change is necessary, it is compensating sampling frequency error (inaccuracy).
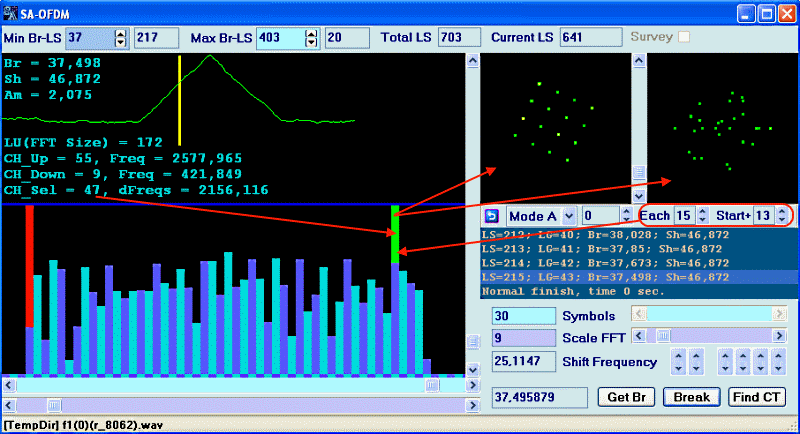
It is curious enough, that within the limits of 15 symbol interval constellation QAM-16 is organized in 47th channel. It is not only the one such channel, and not the unique moment.
I suggest to finish on it The analysis of this signal. But I want to specify some very important points.
1. You can't with such relative freedom to get some intelligible and guaranteed constellation in any channel, without bringing the record/signal to correct parameters (LU, LG, SR, exact positioning on frequency etc.).
2. You will not get such results if you will analyze OFDM signals by B model, while these signals are generated on model A. An absence of the knowledge of this specific moment, is capable to paralyse completely the analysis evenin high-quality recordings. We had been talking about models of OFDM signals in our previous articles, e.g. SA update to version 6.1.2.7 & OCG update to version 1.0.2.7
*** Next part ***
|
|
|
|
Добавлять комментарии могут только зарегистрированные, активировавшие регистрацию и не ограниченные в доступе участники сайта!
|
| Файл создан: 23 Mar 2011 21:58, посл. исправление: 31 Mar 2011 23:30 |
|

