|
|
| Разместил (Author): |
SergUA6  |
| Авторские права |
© http://www.radioscanner.ru |
|
|
Текст
|
Signals Analysis in SA version v 6.2.5.1
Function "Count freqs" usage.
It is supposed that the reader is familiar with the description of the Update SA to version 6.2.5.0/1
In this article we will consider possibilities and restrictions of function "Count freqs" in more details.
It doesn’t matter to this function if the material for the analysis has been received through the phase detector, or there hasn’t been realized any operations in SA, and if some exterior phase/frequency detector has been used, or it hasn’t been used generally. But in the first case, there is information about the frequencies, that allows to calculate parameter "Delta", and in the second there is no such information.
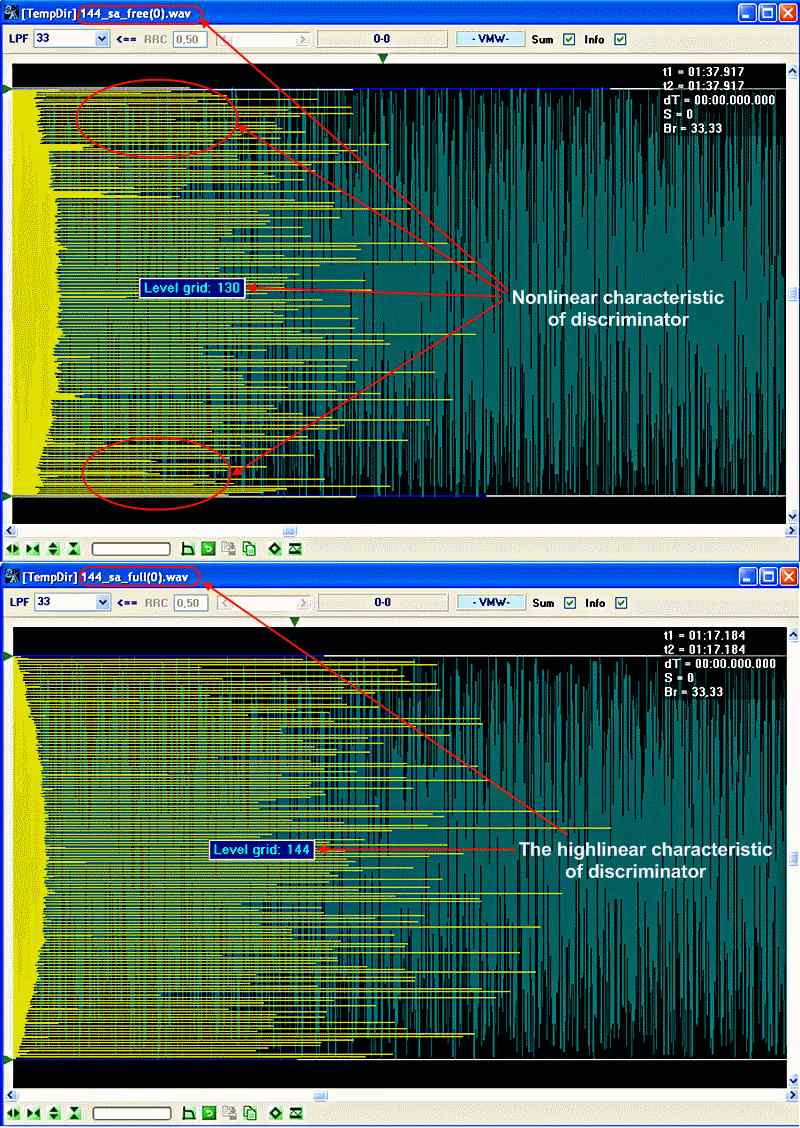
In SA these two different cases are differentiated by color. If the file, which has been processed in the owner phase detector, is loaded in WF, then the signal graphic is displayed by green color, and it means, that there is an information about frequencies. Otherwise, the signal graphic is displayed by the light blue color and function "Count freqs" shows only the size of the grid.
The one signal: on the first screenshot it’s after the phase detector usage, on the second, it’s after file saving and its loading in SA - simulation of exterior proceed.
Such invariancy to material origin, allows to estimate both operation of exterior phase/frequency detectors, and to get some idea about quality of a record in some cases.
We are recommending to concern extremely carefully any indirect means of the records processing, as the quality in this case isn't guaranteed, or at least, demands careful control. For example, the frequency detector in version SA Free, possesses noticeable nonlinearity, and if on signals MFSK-4, MFSK-16 it isn't critical, but on signals with dimensionality of the grid for 80-100 it is already fraught with gross errors in measurements.
In case of analysis of multifrequency MFSK signals above 60-80 frequencies and higher, exact positioning of H-markers on extreme channels can be complicated. In this case, it is necessary to use the mechanism of fixing of the markers, it will also raise an accuracy of measurements at the expense of lowering of value Hz/pix.
For this purpose, it is necessary to increase the size of the histogram on a vertical to necessary value Hz/pix by vertical zoom. Normally the value in 0.5-0.3 hertz on pixel is more than sufficient. But generally, it depends on the frequency plan of a signal (its general band and an amount of channels), and sometimes much smaller values are required till 0.02-0.01. At this, the histogram will be beyond of the display window.
The top and the bottom edges of the histogram is necessary to lead by the vertical slider into the display window. After, it is needed to install on the extreme channel one of H-markers and to fix it, through cliques the right mouse button on the green triangle (icon) of this marker, the triangle becomes red, and the marker itself becomes fixed.
Then it is necessary, to add another edge of the histogram into the display window by the vertical slider, and to install another marker on the edge/extreme channel, then to call function "Count freqs".
You can remove fixation from the marker by the right mouse button click on the red icon, thus the marker becomes green again. Only one marker can be fixed.
Some words concerning determination of dimensionality of the grid.
It is necessary to understand, that function "Count freqs" proceed from that is in a current signal. If the signal is formed on the grid of 100 channels, but in the analysable record the extreme channels are presented as (for example) the zero and the eightieth, then the grid from 81 channels will be the result. Also the algorithm considers the extreme channels, as those channels where H-markers are situated, if to select by the markers lesser channels then there are really presents, then dimensionality of the grid will be accordingly lesser.
The algorithm isn't sensitive to the lapse of the channels, if there is at least 20-30% of the channeles in a signal, then dimensionality of the grid will be defined reliably enough by the extreme channels. Actually, the algorithm is working out quite successfully even in much worse situations, but there is always a limit to everything. And besides, this limit depends on that how the channels are allocated, generally, the more channels is present at the signal, the better analysis data we will get.
The algorithm is sensitive to postfiltering after the phase detector. If it hadn't been realized, or it was insufficient, or on the contrary superfluous, there can be errors even on the signals with outwardly high quality. It is connected to scalability of the algorithm, in the future we most likely will add visual control of results of measurements, and possibility of their correction in a manual mode.
Also it is necessary to remember, that quality of records plays far not the last role. The analysis of an unknown signal, and the demodulation of a known signal are two very different tasks. And we can't speak about the qualitative classical analysis with SNR–20 db, while the demodulator is capable to demodulate successfully the signal with SNR-20 db, e.g. ROSMODEM, OLIVIA and etc.
There are several interesting examples.
X02, Mazielka 2 tone
After the second phase detector, 9 cycles of the manual filtration with frequency of the cutoff 33 Hertzs, and a full screen mode has been demanded. The problems are connected with the fact, that there are very few frequencies are present, they are allocated very unsuccessfully for the current algorithm, and the filter cutoff frequency is very far from the necessary.
JT65A,B,C is analyzed JT65A.
It seems logical to use the grid from 65 frequencies, however, there are other records of this signal JT65A
The grid from 66 frequencies? I can't find an explanation to this phenomenon, except that digit 65 in the protocol title/name isn't connected to the grid of frequencies. In this record the grid from 66 frequencies is really used, or some RX devices care capable to bring in distortions of such level. There is a small drift in the signal, but it is too small for such explicit mismatch. Besides, I have one more record, without drift, where is also 66 frequencies.
It is the pilot implementation of function "Count freqs", further, most likely it will be improved, as optimization and improving ways are exist.
Good Luck~
|
|
|
|
Добавлять комментарии могут только зарегистрированные, активировавшие регистрацию и не ограниченные в доступе участники сайта!
|
| Файл создан: 15 Jun 2011 01:25, посл. исправление: 01 Nov 2011 02:06 |
|


 English version
 Versión en Español