|
|
| Разместил (Author): |
SergUA6  |
| Авторские права |
© http://www.radioscanner.ru |
|
|
Текст
|
SA updating to 6.0.6.1 version. (screenshots are made in 6.0.6.0 version and it is not error, 6.0.6.1 version does not have little errors, which were detected after 6.0.6.0 version was published).
It was decided to take out results of operative measurements in a semi-transparent window in the right upper corner of the form, it will allow to increase easily quantity of derivable parametres if it is necessary. For example: FC value is added, FC - it is the central frequency between horizontal markers. This addition seems more convenient and modern to us.
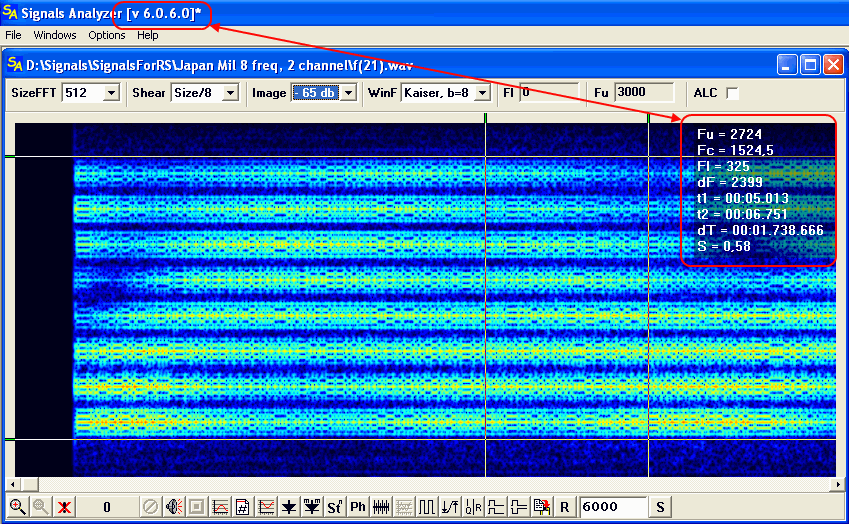
On the sonogram:
Fu - approximate value of frequency of the upper horizontal marker.
Fc - central frequency between upper and lower horizontal marker.
Fl - approximate value of frequency of the lower horizontal marker.
dF - frequency band, which is limited by horizontal markers.
t1 - time position of the left vertical marker in the file.
t2 - time position of the right vertical marker in the file.
dT - time fragment, which is limited by vertical markers.
S - 1/dT time fragment which is limited by vertical markers and which is re-calculated into frequency.
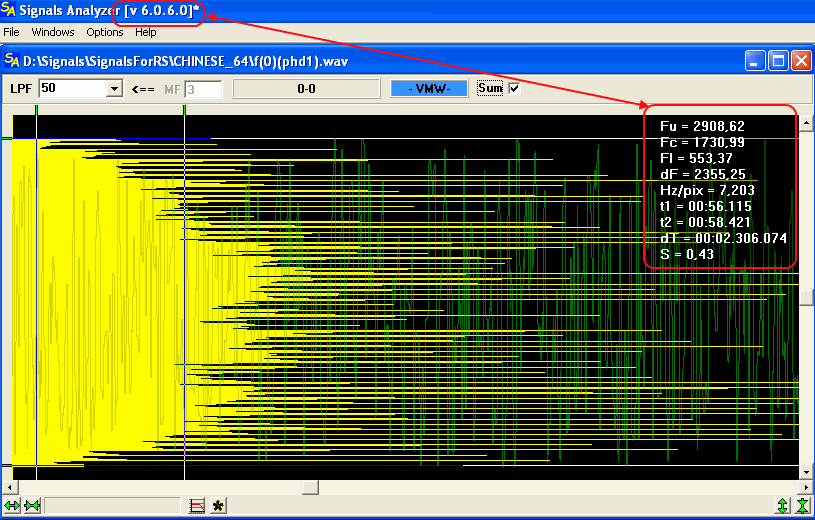
Generally, names of parametres are standard, and there is no sense to repeat them. In the mode of measurements, after the phase/frequency detector the value Hz/Pixel is showing up in addition.
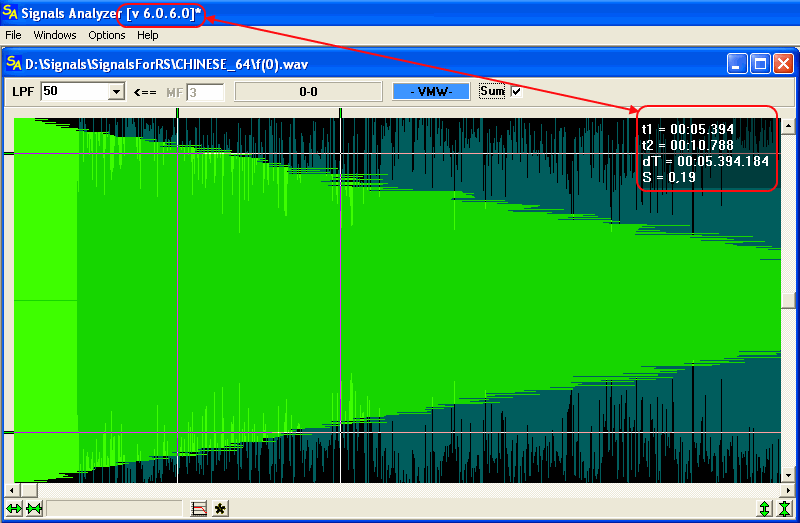
In the waveform browse mode, the horizontal markers do not carry any usefull work, that is why the values of horizontal markers are not outputed/displayed at all.
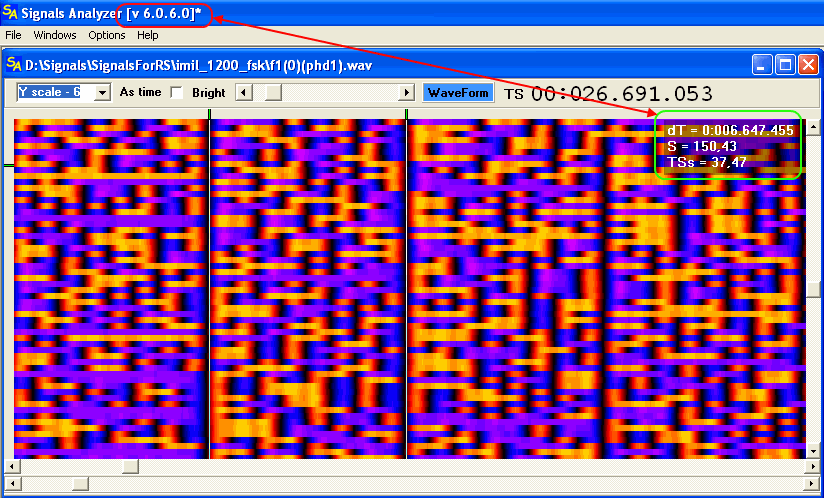
In VMW mode the next values are displayed/outputed/derived:
dT - value of the time interval between vertical markers.
S - 1/dT inverse value, which is equal to frequency.
TSs - 1/TS inverse value of the decomposition line. This value is also equal to the frequency.
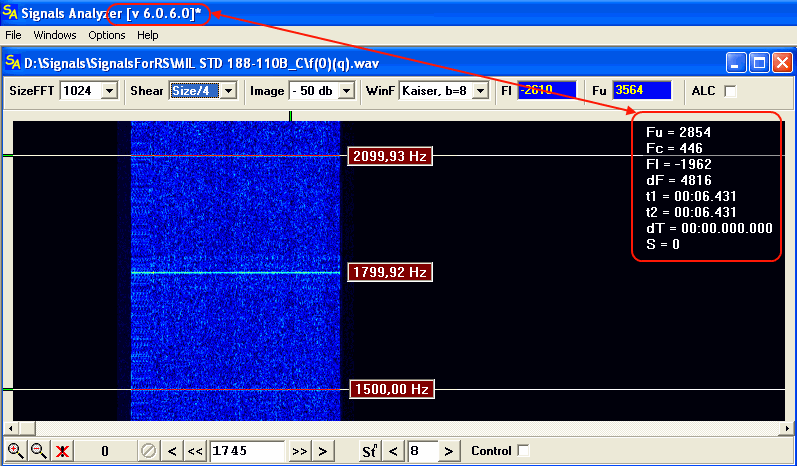
In the exponentiation module standard values are outputed/displayed. But, it is very important to understand that in this module all values, which are linked with direct frequency measurements are not real! These measurements are wrongly interpreted often by many people. For example from the represented image, it does not follow that there are frequencies Fu = 2854 Hz, Fc = 446 Hz and Fl = -1962 Hz in the signal, these are frequencies of the complex signal, that is raised to a power in the eighth degree. There are also no obvious frequencies 2100 Hz, 1800 Hz and 1500 Hz in this signal, these are the complex frequencies enumerated/re-calculated for Phase Plane module after exponentation in the eighth degree. Warning: be attentive, do not confuse measurements on the complex signal in this module with the real signal. It can seem that these values, in general, are conditional/relative and they do not have great importance, however it not so, and sometimes it is very useful and very necessary. Just remember that these are not real frequencies, and sense of these frequencies is a bit different, than usually.
Good luck.
|
|
|
|
Добавлять комментарии могут только зарегистрированные, активировавшие регистрацию и не ограниченные в доступе участники сайта!
|
| Файл создан: 19 Aug 2009 18:42, посл. исправление: 19 Aug 2009 18:52 |
|

