|
|
| Разместил (Author): |
SergUA6  |
| Авторские права |
© http://www.radioscanner.ru |
|
|
Текст
|
Other parameters of the signals.
FSK and MFSK
As it was said above, the clock frequency is a one of the main parametres, and it is really so. If it is not possible to detect and authentically measure the clock frequency, then all further actions are simply losing any meaning. Therefore, let us assume, that the first task was already solved successfully.
The second important parameter of the signal with the frequency manipulation - is the number of the frequencies and the frequency spacing. For example sometimes it is obviously visible that there are 4 or 2 frequencies, sometimes it is not visible, sometimes you can clearly see 4 frequencies while in practice there are only two of them, therefore, it is necessary to know how to precisely define number of the frequencies. For this purpose there is AOF module, and although speed of its operation does not impress, but with help of this module you can answer the question: how many frequencies and what is the exact frequency spacing, and sometimes using of AOF module is the only one way.
Before call this module, you must select the signal’s area, by the time and by the frequency parameters. H markers should not be pressed too strongly to the signal, there should be a space between the upper and lower verges, it is also desirable to filter out the signal from the unnecessary out-of-band noise.
Usually the first start of this module sets the purpose to receive the duration of the minimum transition, so as to adjust settings(installations) for the more thorough analysis. Of course, when You know the clock frequency and the sampling of discretization, you can calculate all this, but it is easier to measure it. It is advantageously to take the length of the sample as a 1/3 of the length of the shortest transition, in most of cases. It will provide the necessary inertia and accuracy.
Biasing of the sample should not take longer than the length, otherwise it will lead to the gaps between the samples and also to the poor-quality detailing. The larger step, the faster the analysis. The smaller step, the more data for constructing of the histogram, and the better results you will get. As usual, only a user is searched for compromise. You do not have to wait until the end of calculations, you can stop at any time.
The example: BUL DIPLO 8-TONE 240.18 Bd
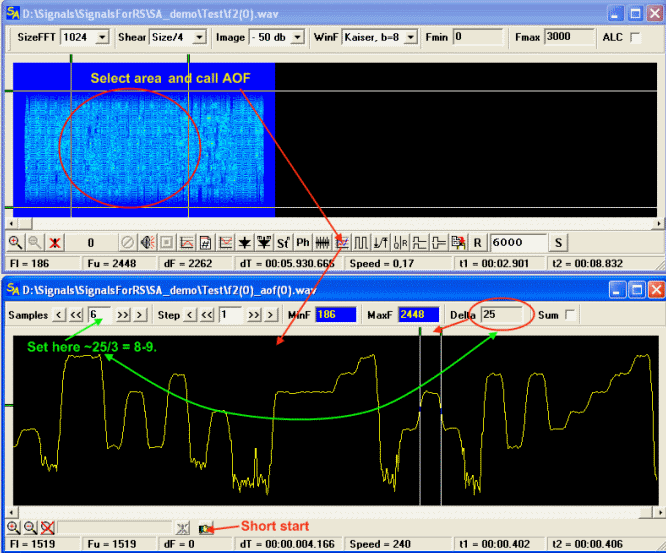
The second start is represented as an actually already working cycle.
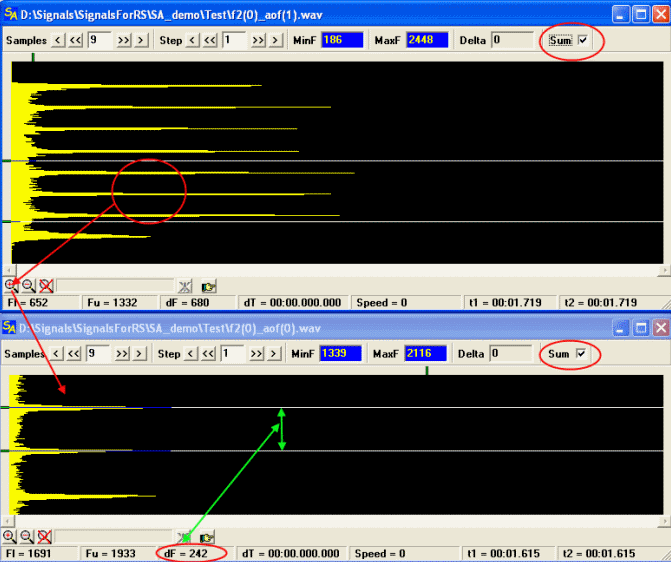
The result is: 8 frequencies, the spacing is about 242 Hrz, the accuracy of the measurements +/- 1Hrz( it’s not the principle restriction and be improved in the future). Usually MFSK signals have the spacing equal to the speed of manipulation, but not always.
PSK and QAM
I separate the records of these sorts of signals into two types:
1) The first type is - the signals, which are having the minimum of distortions or not having them at all. There are no problems with first type, as a rule. It is enough to get the arity and the frequency of the carrier in the power(harmonic’s) module, and open the signal on the phase plane by the call of PhasePlane module.
2)The second type is – the signals, which are having distortions, usually those are real records, which are an absolute obstacle for the all analyzers. This kind of the signals, basically, does not allow to receive even a little bit clear picture on the phase plane.
In a fact, the problems of distortion of PSK and QAM signals are successfully solved by using the adaptive correctors, but it works with an a priori known parameters of the signal. In case of the analysis, the signal is unknown by default, and if it is not possible to receive the arity and value of the carrier in the involution module at once, then all analysis is ended at this point. SA allows to solve the problems with distorted PSK signals in very many cases, and sometimes, with QAM signals too.
The example of the qualitative PSK signal: Italian MIL 1200 PSK Modem , which clock frequency was received by us earlier. We will consider the classical standard method of the arity(order) and the carrier frequency getting. After selection of the signal by V and H markers we are calling the involution module.
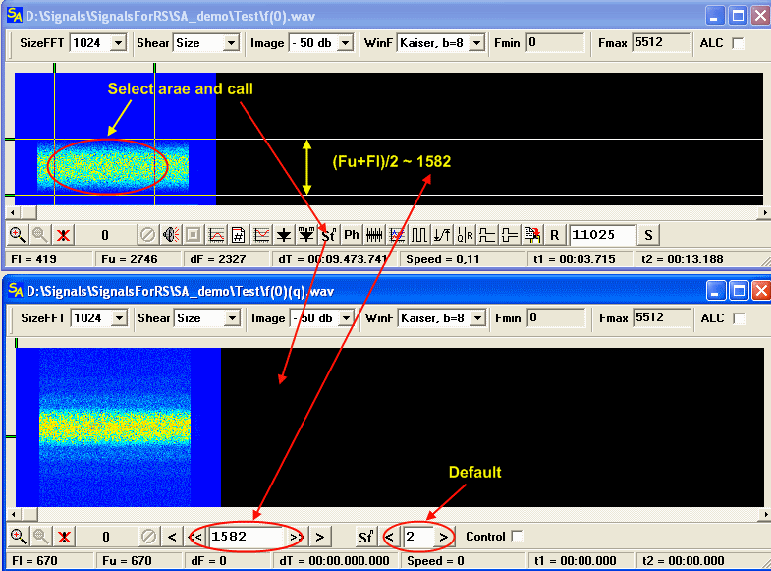
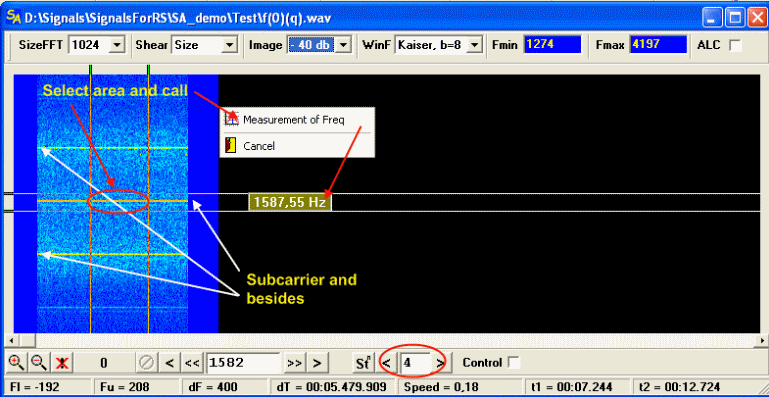
We are changing the value of the harmonic number and recount the sonogram, until three clear lines (carrier line and side lines) will appear. This is the typical picture of PSK signal in the power, which is equal to the signal’s arity(an order of the phase modulation), on this signal it will occur in the 4th power.
Having selected the carrier line with the markers, we are receiving the exact value of this line through the call from Pop-Up menu of the Measurement of Freq function.
The last value, which is measured by this function, is brought in the Carrier field of PhasePlane module by the call of this module. As we are remember the BR (BaudRate) field of this module is filling with value of the clock frequency, which is measured in the main working window. Therefore, the part of fields will be filled with earlier measured values by the call of PhasePlane module.
Here we are calling PhasePlane module.
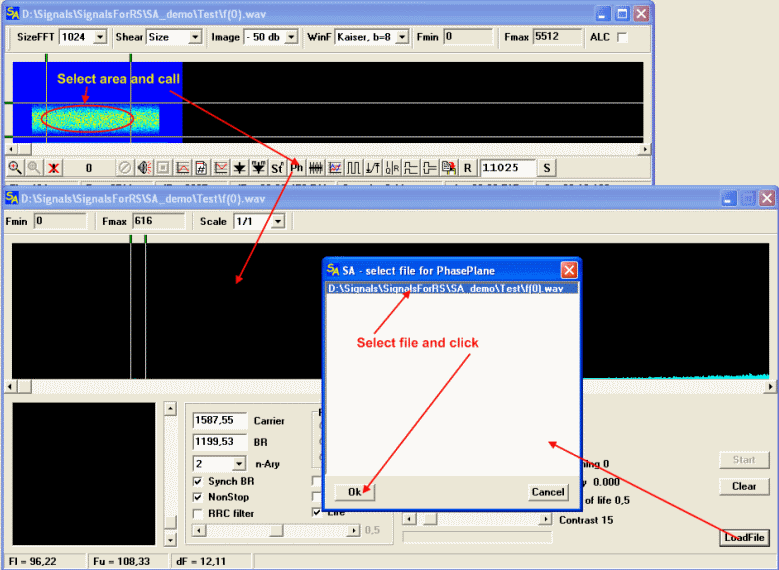
Here we are put down the arity(order) of manipulation and launch the process by Start button.
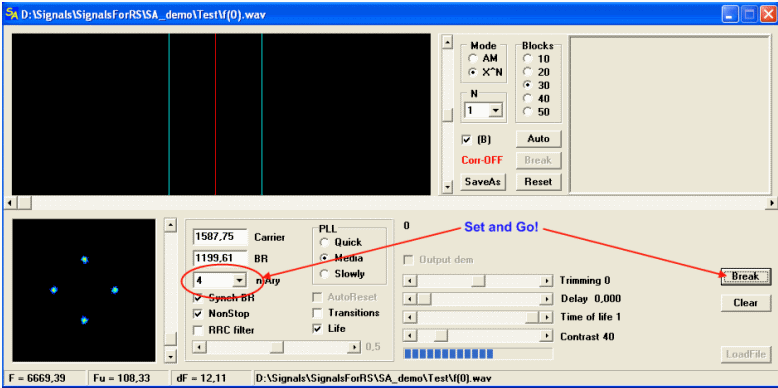
It is the classical method of assess of PSK signal’s parameters. This method does work with the exclusively high-quality signals, and it is suitable more likely for demonstrating of the common principles, than for the analysis of the real signals.
Let's consider the real signal http://www.signals.taunus.de/WAV/MIL188-110B_AppC_ VS.WAV, declared as QAM signal, from Internet page: http://www.signals.taunus.de/WAV/MIL188-110B_AppC. HTML The clock frequency is ~2400 hertz, it is assessed without problems, however is neither the carrier frequency nor the arity of manipulation can’t be assessed by usual methods, and as consequence it is impossible to display the signal on the phase plane.
Of course, it is possible to suppose, what the frequency of the carrier is 1800 hertz, but we won’t do it, in first because the analysis it is not a guess, in the second how will we prove it? The frequency can easily be 1780 and 1820Hrz. As a result of the analysis we must get the value of the carrier frequency, it is best time to use ISD corrector. ISD corrector does work in two modes: 1) the clock frequency mode, 2) the signal’s harmonic mode. The first mode is used always, until the standard lines will appear in any power. The appearance of the lines is a very good sign and it is our goal.
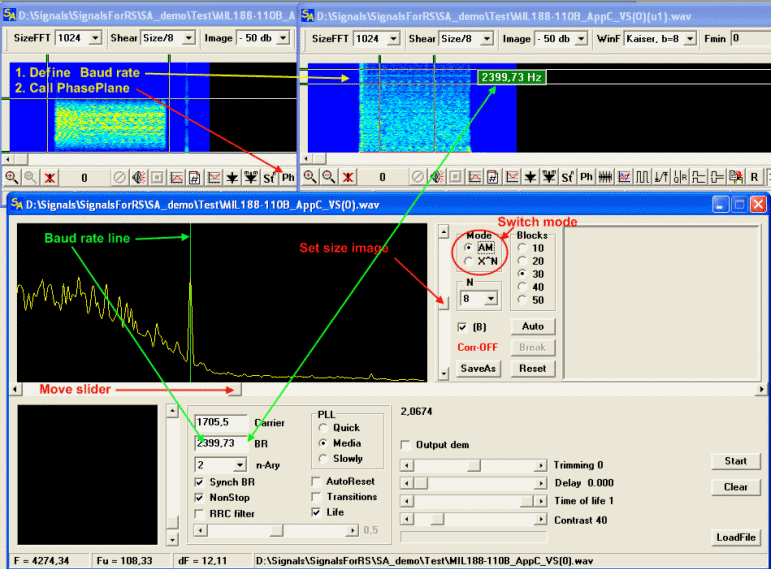
While starting the correction process, it is possible to see as the waveform(signal’s form) is changing in the display-window. After three or four clicks by the Auto button (sometimes is required much more of these clicks), it is necessary to switch the ISD corrector in the X^N mode, and align the signal over the centre(the red line) in the first power. Then it is necessary to run over all harmonics for the purpose of the classical picture appreance, and we will get what we need on 8th power.
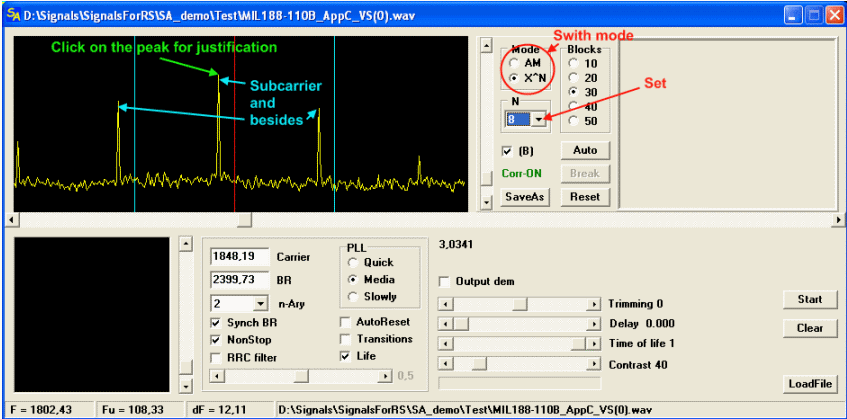
After exact alignment of the signal relative to the frequency PLL, it is necessary to set, by the simple mouse-click on the peak of the carrier, 8th power in the n-Ary field of the viewer and press Start. Further it is possible to continue work of the ISD corrector in X^N mode, by pressing of the Auto button. Definitive finishing is realized by installation of the exact value of PLL’s phase(if it is required).
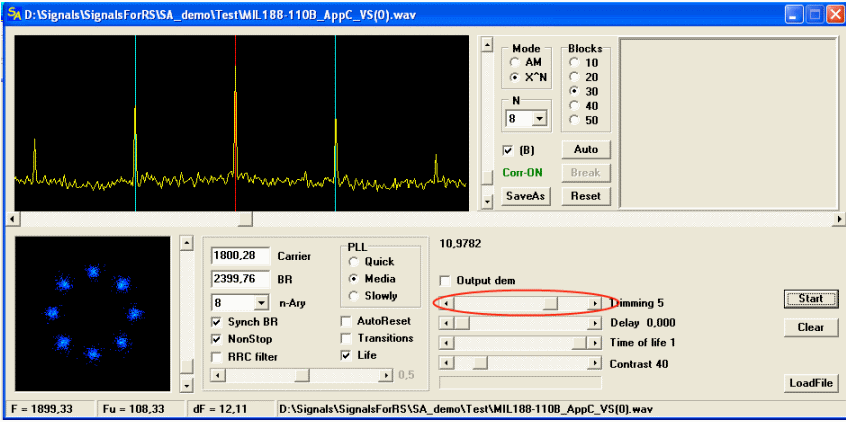
We are getting the perfect result. Besides, it is visible that the signal, which is declared as QAM, is totally not QAM. You can save the signal in the file through SaveAs button. Approximately such technique of correction of distorted PSK signals was represented above. Of course, this technique does not work in all cases, and not always everything is so simple, but it is much better than nothing.
OFDM
Except the clock frequency of manipulation, there are other major parameters of OFDM signals, such a frequency spacing, quantity of carriers and length of the cyclic prefix(if it is used). It is significant that OFDM signals are also separated on two types. 1) The first type is: the signals where the frequencies are distinguishable. Parametres of such signals are measured and calculated easily enough, because it is possible to select the channel, measure the spacing between channels etc. 2) The second type is: the signals, where the channels are not distinguishable or very bad distinguishable.
If to the first type it is enough to apply the methods of the analysis, which are considered earlier, the second type is still die hard. SA does not offer any obvious mechanisms of their investigations.
Some perspective ideas are already in development (for a long time already), and appearance of the tool for work with OFDM will be realized in the near future.
The structure of the signals in the Signals Analysis context.
Overwhelming majority of the signals have the regular enough structure, one of the analysis tasks is detection of this structure and its parametrization. Generally, it allows to put the signal in some group of the known signals or to learn/identify the signal in the difficult conditions. Usually, the function of auto correlation(ACF) is used for these purposes. ACF function can be applied before demodulation of the signal and after demodulation of the signal. But there is a problem, ACF itself is not unique, and the signals with different structures can have identical ACF, therefore, it is desirable to have any possibility to visualize(show) those regularities(regular features), on which ACF is specifies, and probably to detect the new ones(regularities).
For this purpose VMW module is introduced in SA. With help of this module, although not always, it is possible to detect new regularities, and to estimate various known regularities. The principle of VMW module’s work is simple enough. The result of any function, if it is possible, is saving in the file and this file is opening line by line into the display-window. Time in the line is regulated by the user, thus, if the decomposition period in the line is multiple(divisible) or equal to the period of regularities in the signal, then they - the Regularities are well visible.
VMW
Tools of this unit were described earlier, and so some words about nuances. Brightness and regulation of the decomposition in line are very nonlinear, so it is extremely not recommended to use sliders for regulation. It is more surely and easier to use, for this purpose, extreme buttons of the regulators or the fields for change by big stride(big steps), at least the program is oriented for these methods. It is possible to do very rough changes through the sliders, but the accuracy will be lowest. Simply be well informed about all the nuances.
A few words about the “by the angle” and "as time" modes. “By the angle” mode is turned on, if AsTime is not active, and it means that one step rebuilds the image so, that the vertical line is displaced from the vertical axis on the angle in + / - 30 degrees, depending of direction. That mode is meant for the regularities search, if it is not known in advance, if these regularities are even exist. The “on time” mode performs modification of the image by an interval of the time, which is limited by the markers. What mode to use and when to use is it, is only user solves. The image is precisely vertically aligned, through the mechanism of the exact setup/tuning/setting. Simple draw the line on which you want to align the image, while holding the right mouse button.
Several examples of theVMW module using
The signal Italian Military 1200 after FSK demodulator in VMW module.
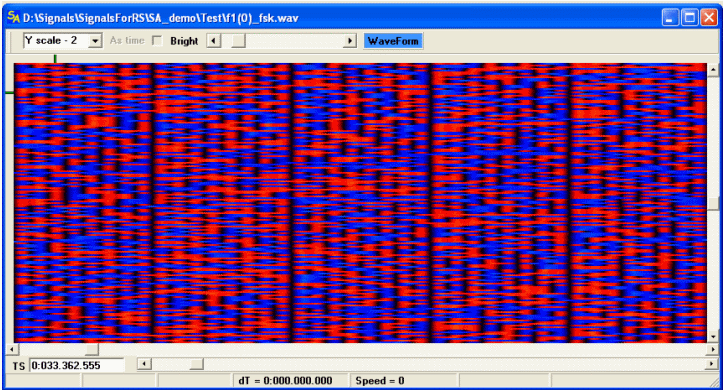
The Clearly visible 8bit structure, which can’t be detected by other methods. The signal’s feature is Italian MIL FSK-2 1200 bd.
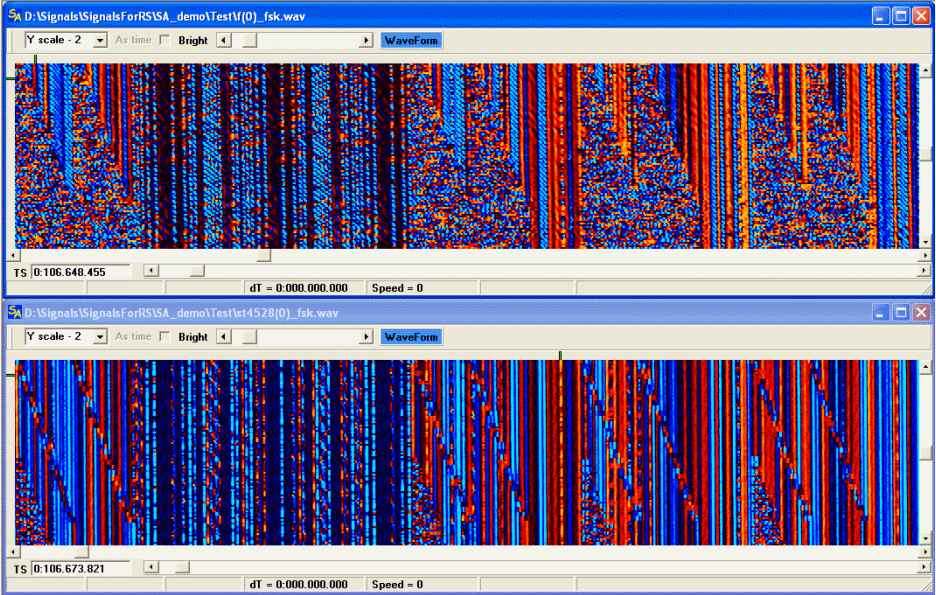
The comparison of the two signals, for the purpose of their belonging to one/common/similar type. The lower signal is STANAG-4285. The higher signal is unambiguously allied/related with the lower signal. ACF function is equal for both signals, but both the differences and the common features are visible in VWM module.
Several words in conclusion
Of course, the signals analysis is not limited by those methods and techniques that were described above. There are enough of tricks and own features in the arsenal of any analyst. It is impossible to describe all cases of SA using for analysis. The sphere of SA application is much wider, than it is described, and there are much more of the signals, but it is beyond the user manual’s scope. The practical examples from the real life will be considered on our internet site, also the creation of some HOW-TO-USE-SA demo clips is planned, because it is better see something once, than hear or read about it hundred times. The project is in the constant evolution.
Good Luck!
|
|
|
|
Добавлять комментарии могут только зарегистрированные, активировавшие регистрацию и не ограниченные в доступе участники сайта!
|
| Файл создан: 18 Apr 2009 18:23, посл. исправление: 21 Apr 2009 23:44 |
|

