|
|
| Разместил (Author): |
SergUA6  |
| Авторские права |
© http://www.radioscanner.ru |
|
|
Текст
|
The classical analysis of OFDM signals.
Possibilities and limitations.
The Classical OFDM analysis surely represents difficulty. Before analyze the real signals we will consider the main methods and principles on the synthesized signals. It is typical enough and very productive method.
For synthesis of OFDM signals the OCG program is used. As usually, I underline, you can use any other program both for the analysis and for synthesis, it is important that results would not call doubts, could be verified and have been repeated.
It is supposed that some bases of OFDM creation are known, it does not demand special substantiations as the analysis it is not simple and not only usage of this or that analyzer.
Extensively, it is experience and knowledge of an analyst, it is an ability to generalise, to draw the conclusions etc. Before appearance of OCG, the analysis of OFDM of signals, at least, for me, carried chaotic, unsystematic and extremely not productive character, but the possibility of synthesis of the various by parameters signals has allowed to develop certain techniques and the common approaches. In practice all it does work and does work good enough.
Standardly the task of OFDM analysis is to define:
of the clock frequency of manipulation,
the value of frequency spacing of channels
quantities of the channels,
modulation in the channels
definition of the presence and length of the cyclic prefix (CP),
features of the signal if the such are exist.
Let’s synthesize three signals, with one, with three and six channels and we will look, as it looks from the point of view of the analysis and what is possible to receive from all this.
Parameters for the signals :
speed 100
spacing between freqs 100
CP it is not used
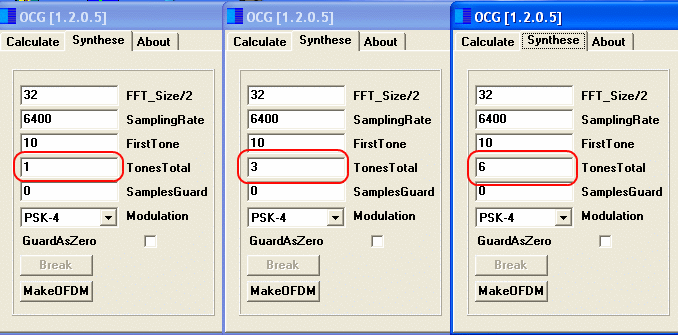
The general look:
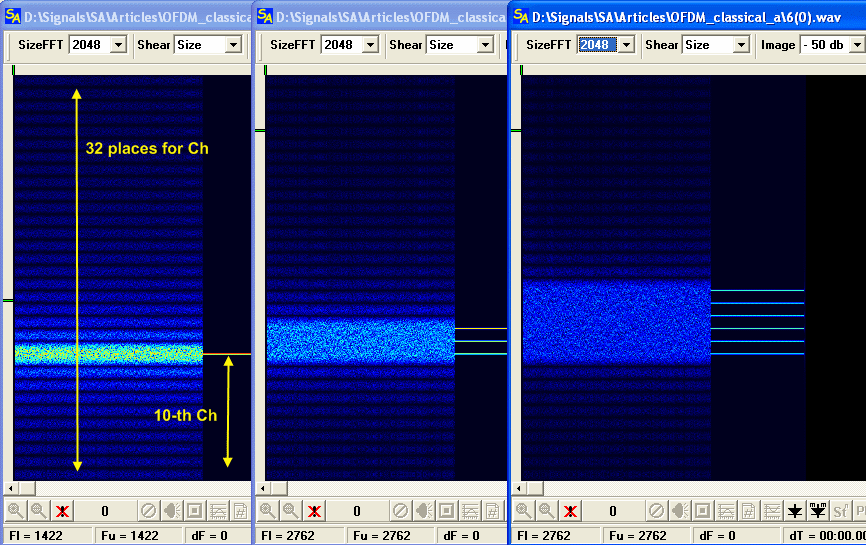
Detalization:
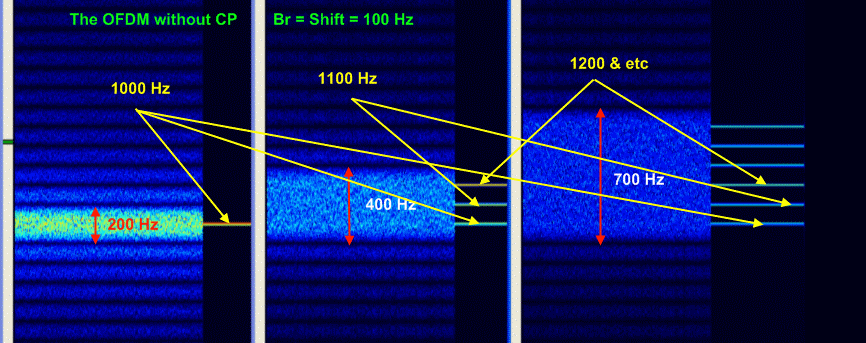
Please pay attention that the whole grid of the frequencies, on which the concrete OFDM signal is forming, is well visible, in this case it is 32 frequencies.
Places for the carriers in this grid have the minimum level of noise, in an ideal, this level is equal to 0. Noise is intensive enough and it has the maximum level in the immediate proximity from the extreme channels of the signal.
The single channel has standard parameters BW=2*Br, and in the signal the channels are overlapped. The unmodulated carriers do not give any side radiations/noises, therefore, the noise does carry in it the information about speed of manipulation, which can to try be extracted for the purposes of the analysis.
Besides, the very important observation: is that the extreme channels owing to the special layout, have the areas, which are not overlapped from the adjacent channels. It means, that even in the signal without CP, there is a possibility to receive couple of more or less normal channels for the analysis, it also means that the presence of the unmodulated carriers or skipped channels in the signal, is automatically gives on two channels with the special characteristics.
Channels in the signal without CP are not distinguishable visually.
The complete width of the spectrum in the active part of OFDM signal = (N-1) *dF+2*Br Where,
N- is the quantity of channels
dF- is spacing between channels
Br-is the speed of manipulation
The radiation outside of this spectrum sometimes can be suppressed, because it is parasitic and out-of-band. In very rarely cases, it can be suppressed to zero, not everything is so simple, and rough suppression is fraught with the strong deterioration of parameters of orthogonality. Usually the various and difficult enough methods of reducing of the level of these side components are used. We synthesize the same signals with CP and we will look, what and how varies in this case. Lets take equal CP, for example to 10 countings.
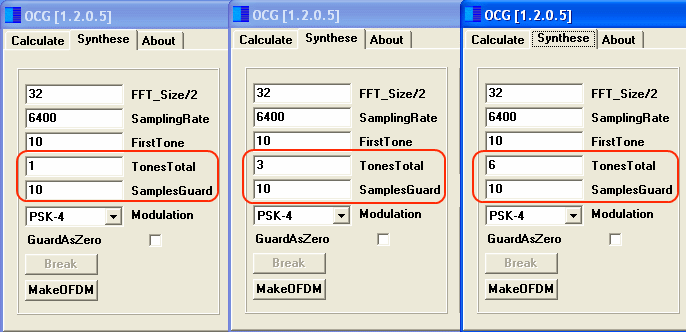
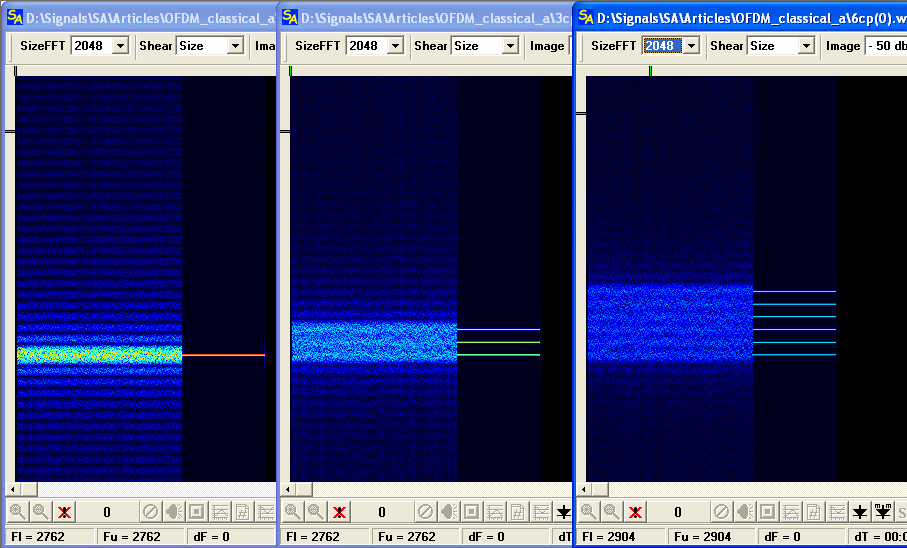
The first and the obvious the channels are becoming distinguishable. Generally, the more CP, the better channels are differ, that is happen at the expense of the speed of manipulation lowering at the former spacing of the channels, that leads to smaller overlapping of the channels in the signal, and at the expense of an averaging-out on sonograms and graphics, it becomes notably.
The signals without CP have full overlap and the channels are not distinguishable.
When CP length is equal to length of the symbol, then it leads to reducing of the speed of manipulation twice and to full division of the channels, it does also switch OFDM signal in the category of the classical multi-channel signal, where is the spacing between channels is > = 2*Br.
The second interesting moment is those "unclear" positions in the grid of frequencies for the channels. These *unclear* positions are not used, in case if, in the signal without CP, the noise level in these positions aspires to zero, and in case if CP is used this condition does not work.
The reason is simple, formally in the signal with CP the conditions of orthogonality are disrupted , but this artificial disruption, which is brought at transmission, is also can be easily eliminate on reception by removing of CP , and the purpose of CP insertion is to give this "an unnecessary slice" to MSI with the purpose to save rest of part ungarbled. But it is already the theory of OFDM creation.
Now we know all that is necessary for us, and we can start to apply that knowledge on practice.
Lets consider the signals without CP
Definition of the speed of manipulation: If there are out-of-band radiations, we must cut the signal itself, after we detect the noise, and we receive the speed of manipulation.
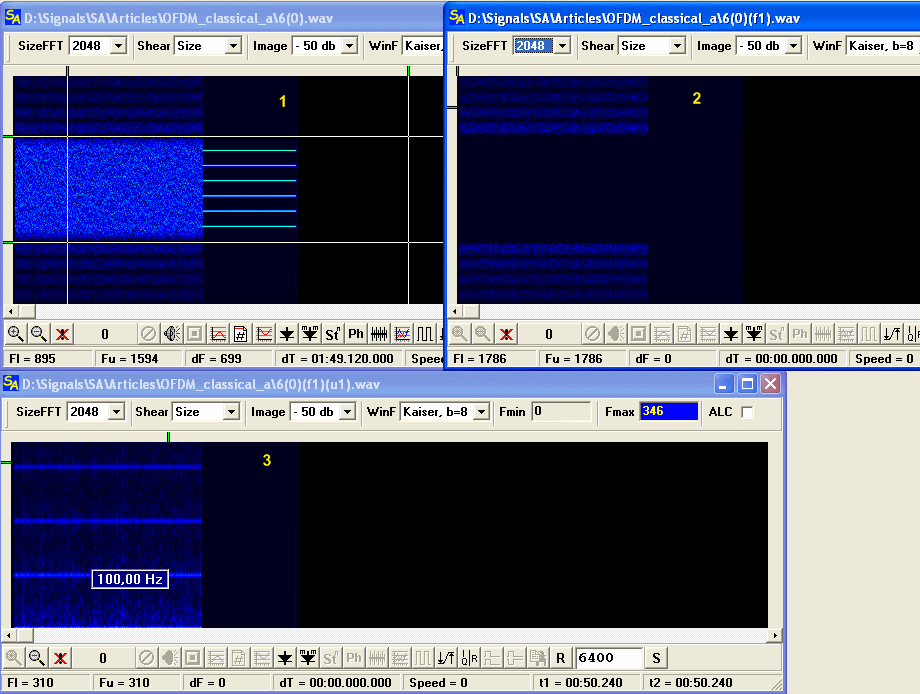
If there is no out-of-band noise or it is very weak, we try to select one of the extreme/upmost channels and to receive speed of manipulation from it. The problem is that the channel width, as a rule, is not known, that’s why it is necessary to make/realize some measurements, approximately the way showed below:
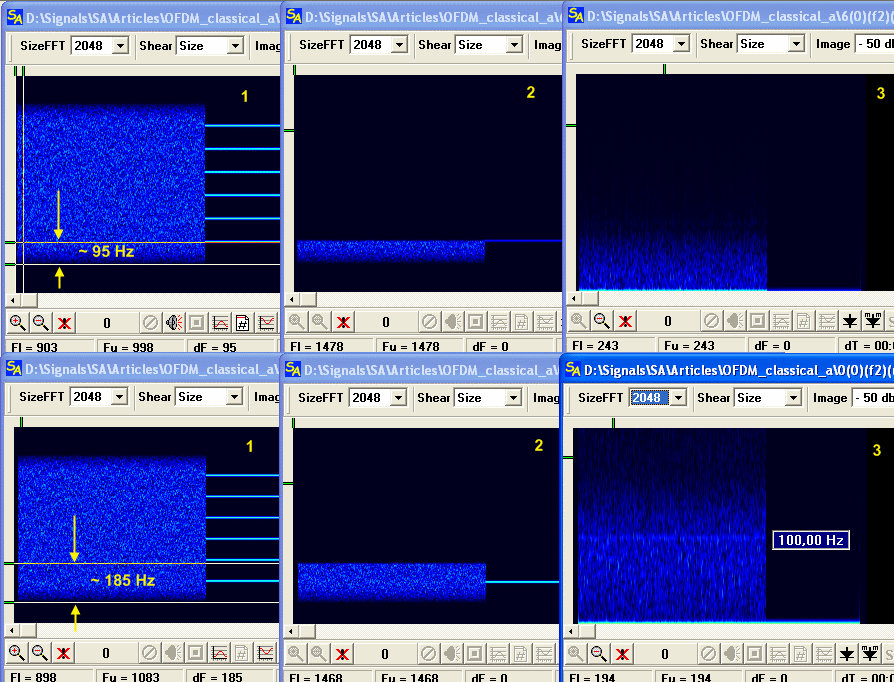
At the appropriate quality of the signal it works practically always. Further, knowing the speed of manipulation, and knowing or assuming that it is OFDM without CP, it is rather easy to receive the quantity of the channels, which is equal to (BW/Br)-1, the spacing is known and equal to Br. The presence of pilots-tones or not used channels in the signal, increases chances of exact definition of parameters, because of possibility to make measurements not only on two channels, but on greater quantity of channels.
The signals with CP
The general approach is exactly the same, with the difference that the channel can be selected much more reliable, because the boundary/verge is usually very well distinguishable. It is also desirable to select side/utmost/extreme channels, because these channels have the least overlapping with its neighbor channels, and because of it they have much higher reliability of determining parameters.
Manipulation for any kind OFDM is defined same way as on selected channel. Usually, if CP is short it means that it is the upper or lower channel. The Problems in this case can be that the extreme channels very often are auxiliary/official and the modulation in them can be special.
The practical examples.
We are considering the common principles and approaches, but it does not expect the thoughtful analysis. The Signals are very different, the quality of records, as a rule, is the lowest and before to apply this or that method, it is necessary to estimate availability of its applying at least.
The attempt to solve the problem of definition of the speed of manipulation "directly/in a forehead", through removal of the signal and noise detecting, is often dooed to failure, because the noise is absent or has the extremely non-uniform allocation, it is desirable to view the graphical spectrum of the signal before make any measurements, it will allow to select both width of the noise-bare for the analysis and its part upper or lower from the signal.
It is extremely desirable to use at the measurements of the clock frequency two methods of detecting:
the classical capturing of the envelope
the modified method.
It is always necessary to confirm the received value by any other methods, this will allow to avoid many errors.
The Example.
The Record from our base of the signals, DRM. Lets estimate chances of the clock frequency manipulation definition by looking on the graphical spectrum of the signal.
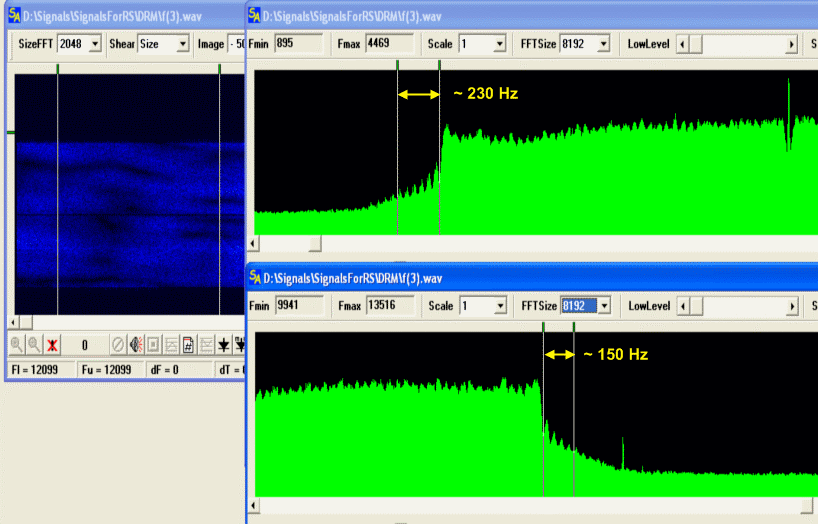
It is well visible that the level of radiations, which are interesting for us, occupies very narrow bar about 230 Hz from below and 150 Hz from above the signal. We shall cut/remove everything what is behind these limits to receive as much as possible accurate picture.
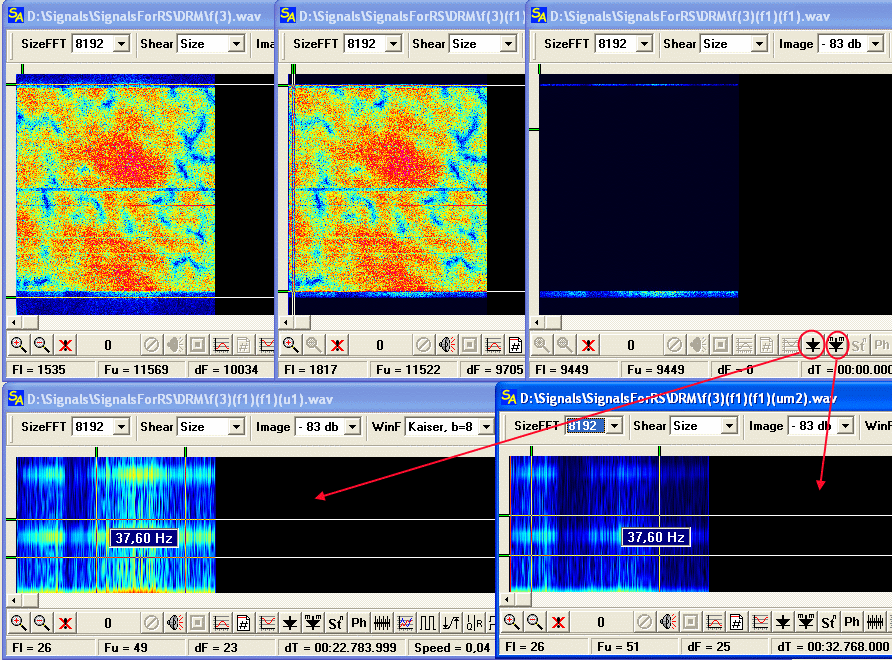
Both methods of the envelope capturing give good and convincing results of the clock frequency of manipulation value ~37.6 Hz. Whether we check if it is so, by having selected the lower channel and having received the clock frequency directly from it.
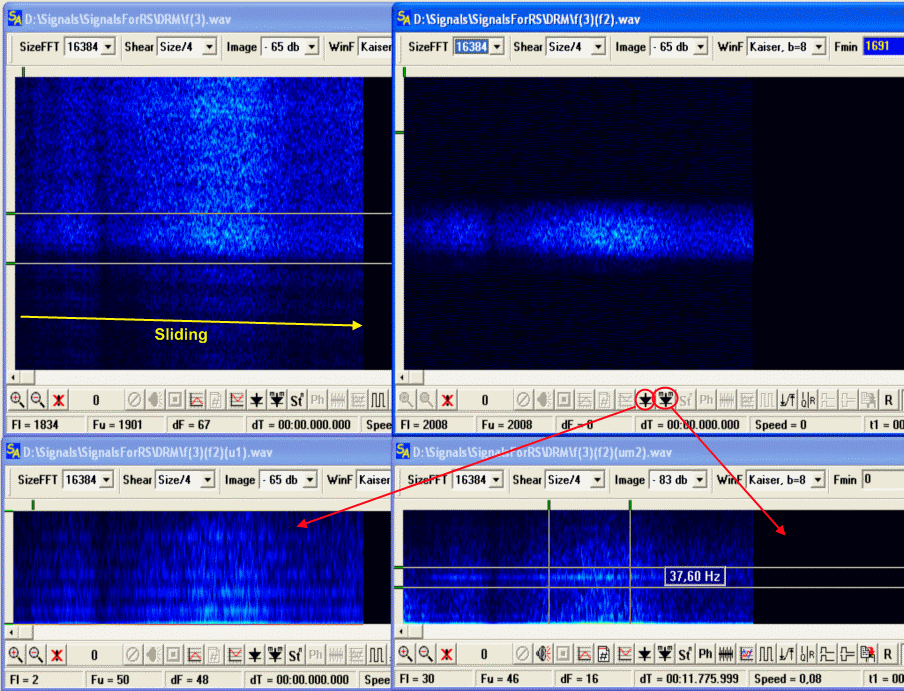
The stuff you can’t see on graphic is well-visible on the sonogram. The signal does have not big drift down in frequency, and because the DRM stations are ground-based not moving objects, the more likely it is a problem of the receiver.
It is visible that the classical detector, in a case with selected channel, does not give the convincing/clear picture, while the modified detector confirms earlier received value, which can be considered as reliable. If we would have tried to select the channel at once and used only the classical detector, then the most likely the result would be *zero*, that’s why:
It is always desirable, to try to receive value of the same parameters by the different ways and methods and, if it is possible, by different tools, generally it guarantees correct result and allows to avoid gross errors.
The exact spacing and the quantity of channels can be received by several ways:
1) The first way is the most simple and labour-intensive way: to count up channels on the graphic and to receive the spacing from an occupied band.
2)Another way is to look at the signal’s features, and to calculate the necessary data with smaller expenses/costs. The Feature is - two pilots-tones with the spacing in 750 Hz precisely, and with 19 channels including pilots-tones. We get, the spacing, which is equal to 750 / (19-1) = 41.6 (6) Hz. The signal’s spectrum from centre of the lower channel to centre of the upper channel is about 9504 Hz.
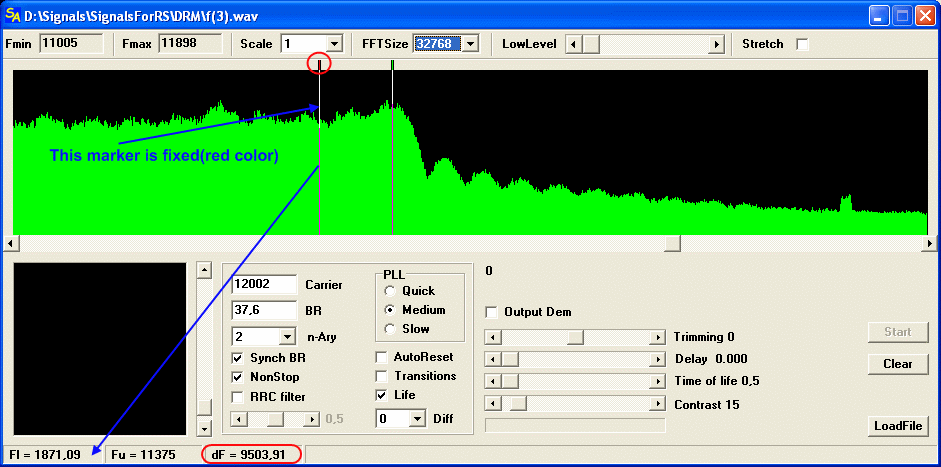
The number of channels is equally to (9504/41.6 (6)) +1 ~ 229.1 that is 229. The more exact measurements can be received, if to take not the centers of channels (because the error in definition of them can be big enough), but take the complete spectrum of the signal from the minimum of the lower channel to the minimum of the upper channel, the result will be much more exact.
the quantity of channels is calculated from earlier resulted formula (N-1) *dF+2*Br
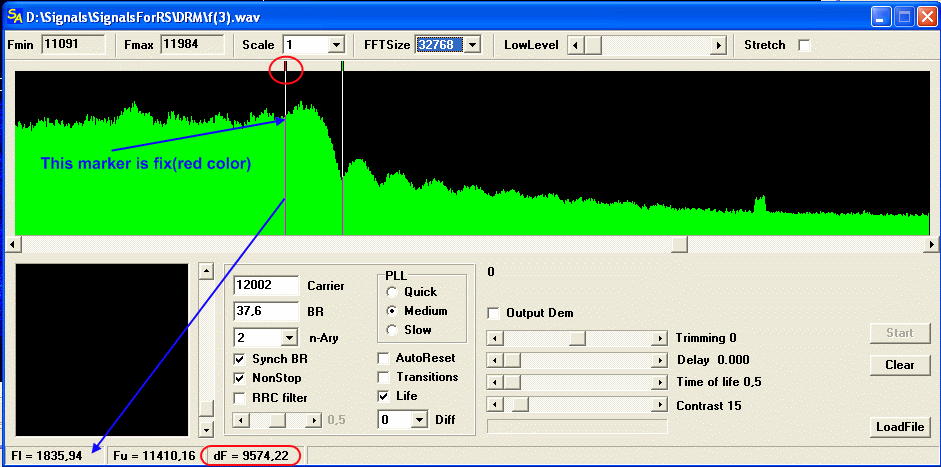
The complete spectrum of the signal is equal ~9574.22, then N-1 it is equal (9574.22-2 * (37.60))/41.6 (6) ~ 228.00. That gives the same 229 channels, but it is considerably more exact value, because it is easily to define precisely the deep minimum on the graphic, than a fuzzy/unclear maximum. If in utmost channels it was possible to receive the value of carriers in the exponentiation/ involution module, then it is necessary to be oriented on these values, although it is not always possible.
It will not turn out to see the modulation in channels of this signal. There are two reasons for it:
1) In first - even when we are selecting the utmost channels, we are still selecting them not with precision and accuracy, but with some degree of overlap.
2) In the second – QAM modulation in channels is used in DRM. This modulation is hardly observable in the current situation. Practically it is possible to observe PSK-8 (pi/4 DQPSK) at the classical analysis of OFDM signals. The more difficult modes demand the record with very high-quality with very great CP values or the special OFDM demodulator.
Often analysts are trying to receive the value of the clock frequency of manipulation through the selection of OFDM signal, and capturing of the envelope. This method cannot be recommended as a common method, because it does work only in very special cases, and it demands mandatory check up/verifying of results. Because, theoretically, it is possible to receive anything you like with such method, besides, that is purely necessary.
The Example, SkyOFDM. Having taken the envelope of whole signal, we get totally not all that that we would like to get. But in this example from the description it is visible that the capturing of the envelope of whole signal – it is well thought-out and reasoned step, and the purpose of it - is not the getting of the clock frequency of manipulation, but the confirmation and hypothesis check up.
The typical example of erroneous conclusions, because of not correct actions is represented on our forum. From the first discussions the clock frequency was defined as 80 Hz.
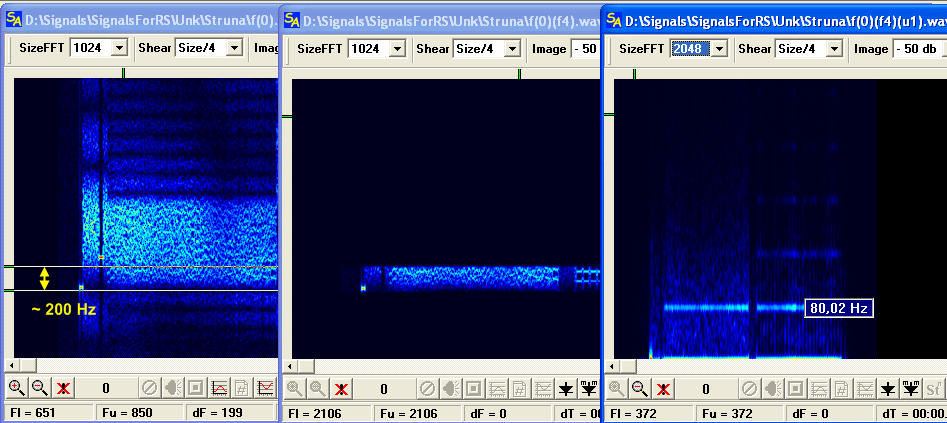
The mistake is that there has not been taken any attempts to check up/verify this value on reliability, at least by this way:
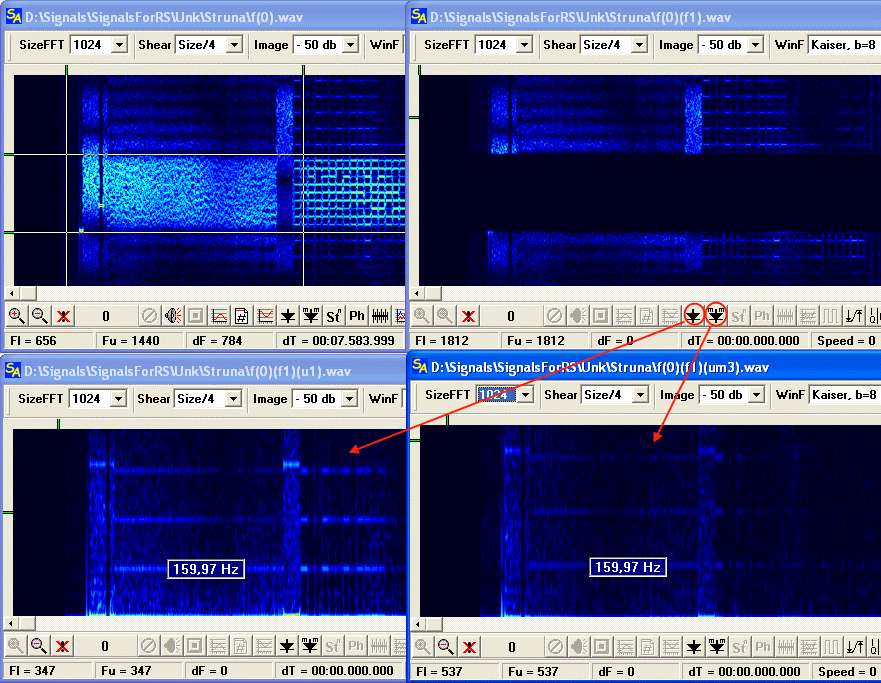
It is very clear and obvious that the clock frequency = 80 Hz is not so convincing. There is the reason in these discrepancies, and this reason must be find out, we are also must find out what is the signal is that too. The analysis of this signal (as enough difficult and contradictory) is described in the article in details, that’s why I will not stay long on it, I only want to simply pay Your attention that any received value as a result of the analysis should be checked up and proved. Any discrepancies should have the clear reasons, and if these reasons do not manage to be found, the analysis process is going to deadlock or it went by false path. By the way this happens very often..
Definition of the fact of OFDM signal is the very interesting task of. Frequently the internal structure of the signals creates the illusion of OFDM presence, and if do not know the methods of substantiation and methods of verification, in my opinion, the analysis process is turning into the wasting of time. OFDM signals with CP, have the characteristic ACF, for which the second maximum gives an approximate frequency spacing between channels.
The view/look/image of this maximum, generally, is not so informative, because it depends on:
the signal’s displacement/shift on the frequency
frequency of discretization of the record
from position of the working frequencies in relation to a grid of the frequencies of formation.
As the analysis assumes a priori absence of the information about the signal, that means that there are no any bases to believe that, for example, the negative burst is the guarantee that the signal is generated on the odd harmonics.
In a case if the supplier of the record guarantees the absence of shift of the signal on/by frequency, the ACF look/view can be taken into consideration. But, as a rule, such guarantees are more often only declared, than are present actually, because the approach to the analysis is extremely not serious for overwhelming part of people.
The characteristic ACF for OFDM with CP, generally looks approximately like this:
Let’s take the same DRM.
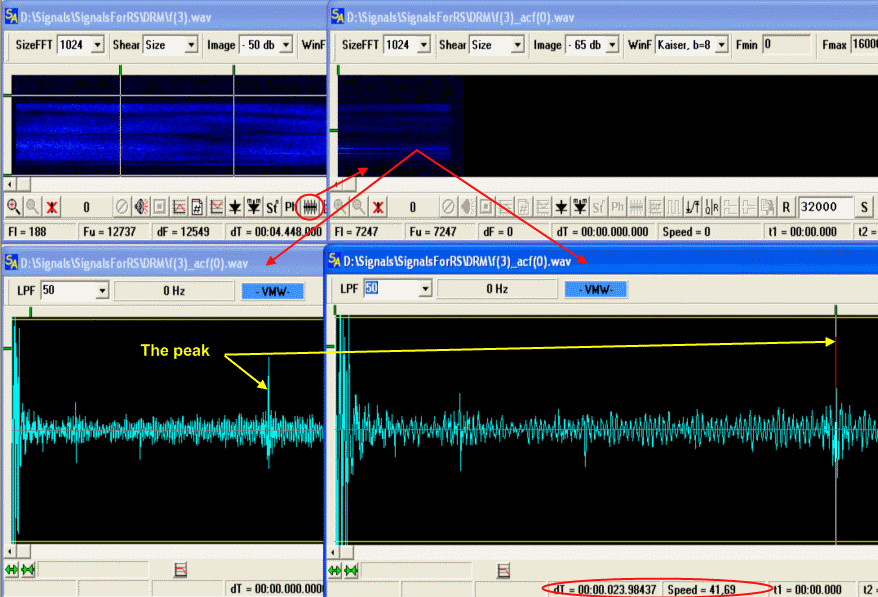
We are receiving the approximate value of the grid frequency spacing about 41.69 Hz, it is close enough to true, but, in this case, it is not necessary to rely on accuracy, because the value in any case needs to be perceived as strongly rough/ tentative, the mistake can easily reach 4-5 and more hertz. Other example is from our site, DAB.
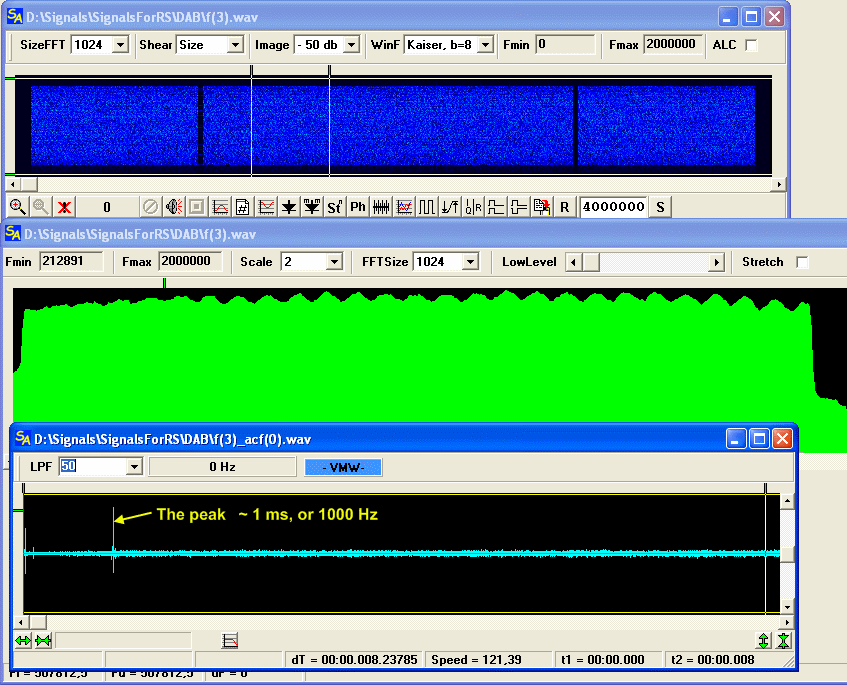
Presence of such peak on ACF specifies the very high probability that the signal belongs to OFDM. Such peak is alone and it also does not depend from sampling position by which ACF is taken.
The Minuses of this method:
necessity of durable/long enough fragment of the signal,
at very short CP , the burst does have very small amplitude
rather strong error in definition of the exact spacing
Another indirect sign of OFDM, is the absence of an expected clock frequency line, after the envelop was captured. The method is not strongly reliable, but, for example, if spectrum’s width of the noise-like signal is 1 or 2 kilohertz, then in case of the classical modes of manipulation, such as QAM or PSK, it is logical to expect the clock frequency around the same values. If such clock frequency can not be find out, the chances that it is OFDM are very high. Although it demands proves and confirmation, however any conclusions demand confirmations.
Another one indirect sign of OFDM is the even enough distribution of capacity/power of the signal in the limited strip/bar of frequencies. Many receivers do everything *they want* with this distribution, at the same time they do strongly complicating the analysis not only of OFDM signals by such activities.
The presence of burst on ACF says that the signal, most likely belongs to the class OFDM and has CP. CP with duration 2-3 msec is used very rarely, at least on SW. Duration CP is possible to define both in countings, and in time slices/intervals/fragments, it does not play a special role, but usually it is spoken about time. The length of CP is calculated from the received parameters. These parameters must be received during analysis of the spacing between channels Shift and clock frequency of manipulation Br.
Thus the length of CP is equal to (Shift-Br) / (Shift*Br) , ofcourse the accuracy here is defined basically by accuracy of measurements. For example, for DRM the duration of a protective interval (CP) is (41.6 (6)-37.6) / (41.6 (6) *37.6) ~0.00259 seconds or 2.6 msec approximately.
If the signal has sufficient duration and acceptable quality, the classical analysis in SA guarantees accuracy of definition of parameters at least in 0.1 Hrz.
Advantages of the classical analysis:
it doesn’t matter how many frequencies in the analyzed OFDM signal, 3-30-300 or 3000
it is also, generally, doesn’t matter if the signal is generated on even or odd harmonics it does not influence results
for the score of the very strong averaging-out, the classical analysis is insensitive to separate/single/some anomalies in the signal
Disadvantages of the classical analysis are:
impossibility to work correctly with short signals
impossibility of reception of a bit stream (while the universal demodulator can provide it)
impossibility to allocate the necessary channel in the pure state
the extremely big problem is to work with the signals having very short CP.
Despite minuses, the classical analysis, in most cases, allows to receive quite good results at the analysis of overwhelming majority of OFDM signals. I hope this article in some measure will help with it.
Good luck.
|
|
|
|
Добавлять комментарии могут только зарегистрированные, активировавшие регистрацию и не ограниченные в доступе участники сайта!
|
| Файл создан: 26 Jun 2009 22:16, посл. исправление: 27 Jun 2009 15:51 |
|

