|
|
| Разместил (Author): |
SergUA6  |
| Авторские права |
© http://www.radioscanner.ru |
|
|
Текст
|
Updating of SA to version 6.0.5.4
Preliminary tests of possibilities of the phase detector, have seemed to us very promising, in Result the improved analogue of AOF module has been developed on the basis of the phase detector. I would not tell that the developing process of this module was easy, but the main technical problems were managed to be solved, the tool has become Functional enough, flexible and it has number of possibilities, which are unavailable in old AOF module. New module also solves The primary goals of definition of parametres of frequency characteristics of MFSK signals.
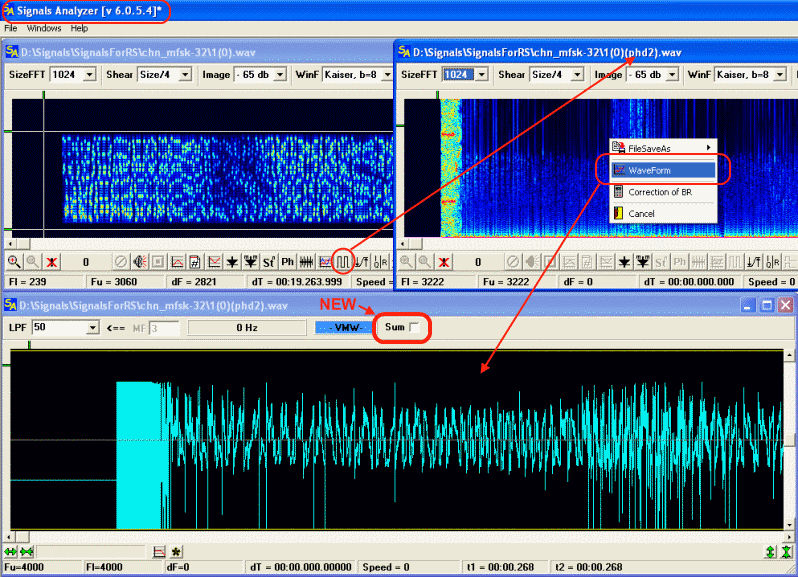
The switch "Sum" is added in WF module. Activation of that switch leads to construction(in the displaying window) of the histogram of that part of the signal, which is currently displayed on the screen.
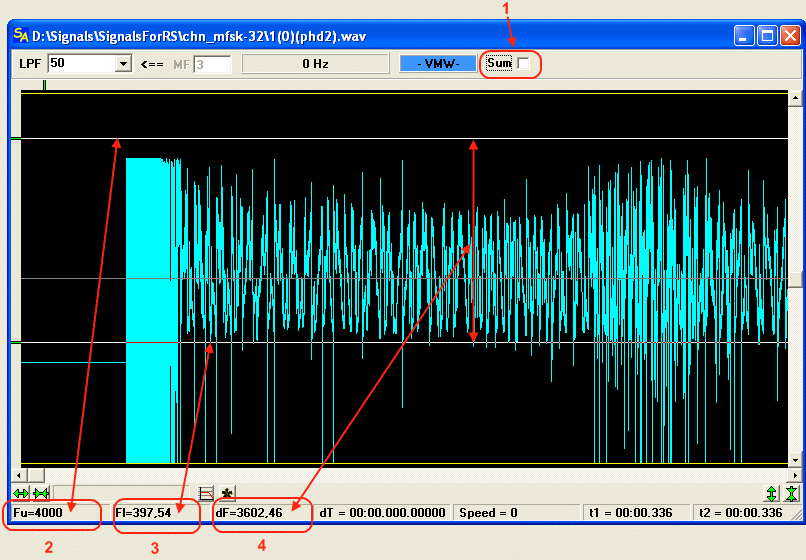
New fields are added:
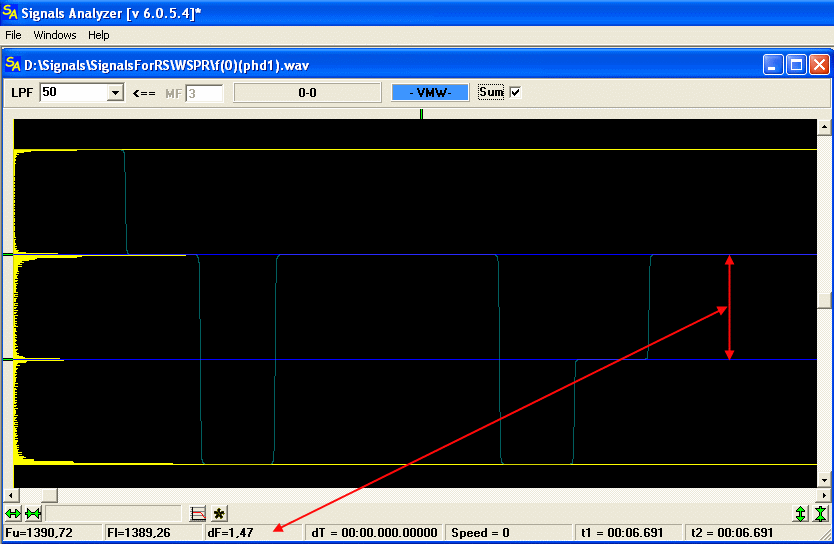
1 - switch of the histogram's represantion. It is swtiched off by default
2 - frequency, on which the upper horizontal marker is located
3 - frequency, on which the lower horizontal marker is located
4 - delta of frequencies between upper and lower marker
Precision of measurments of frequencies is 0,01 Hrz. It is the very serious value. Although in some cases such accuracy is not required, but nevertheless, it is provided in overwhelming majority of cases.
Work is processing in the histogram mode, or in the accumulation mode. Per se these modes are same.
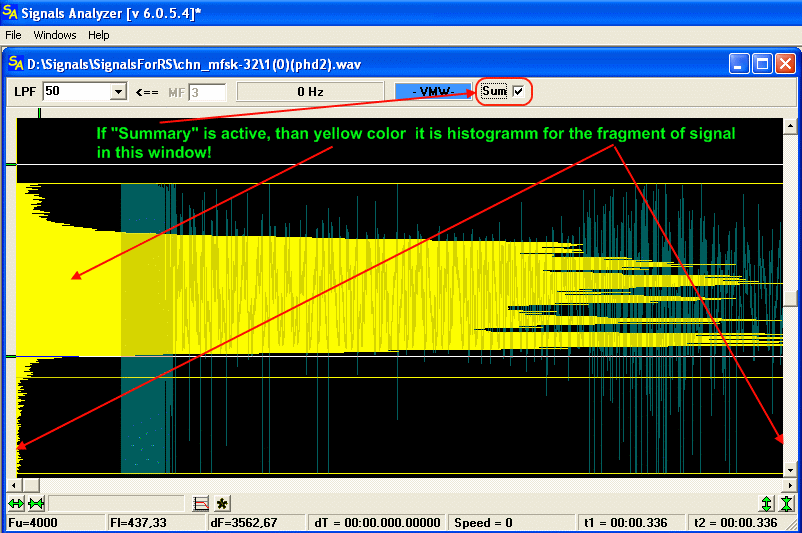
As it was already spoken, swtiching ON of "SUM" mode leads to construction of the yellow histogram. The visible part of signal is used as the data for histogram's construction. It seemed to us, that there is a sense do not overlap the visible part of the signal completely by the histogram, thus we only reduced its brightness. This allows to see, by moving the sliders, which part of the signal is currently represented as histogram. In general it is necessary to notice, that all
elements of the window do work in absolutely regular mode that gives extreme flexibility and efficiency.
As it is better to see once, than hundred times to hear, we have prepared some videoclips from which, You will understand the main principles of work in "SUM" mode.
Some words about accuracy of measurements, and some additional possibilities, which are accessible in the new Mode.
You must realize, that if You are working in the small window, or reduce by scaling buttons the histogram image to one hundred pixels by vertical, then the declared accuracy in 0.01 Hrz loses any meaning. Anyhow the pixel consist several tens or hundreds of Hertz. Thus, the declared and provided accuracy is realised only on full-scaled images, which are having the greatest possible size, at least by vertical.
Accuracy of measurements depends on the signal bar and sampling rate of the file. It is also necessary to understand that the frequencies, which are above then half of sampling rate and below zero do not exist. But the scale on vertical axis allows to reduce the graphic, at an intersection of these natural boundaries, indications of markers do not vary, and are fixed on the level of boundary conditions.
Important: The histogram mode can be switched ON at any time and on any file, but, it is possible to adequate display the frequencies only on files, which were prcocessed by the phase detector, and these files should be received directly after operation of the phase detecting in the program.
In the mode, when the histogram's construction is active, but the file does not grow out of operation of the phase detector, the frequencies are not displayed and fields for these values will be empty. The histogram, in this case, represents allocation of amplitudes in loaded wav file. Sometimes it is useful, because it allows to detect files with amplitude limitation, files, which are made with 8 bit coding and files with various anomalies.
Several screenshots:
Signal CHINESE-32
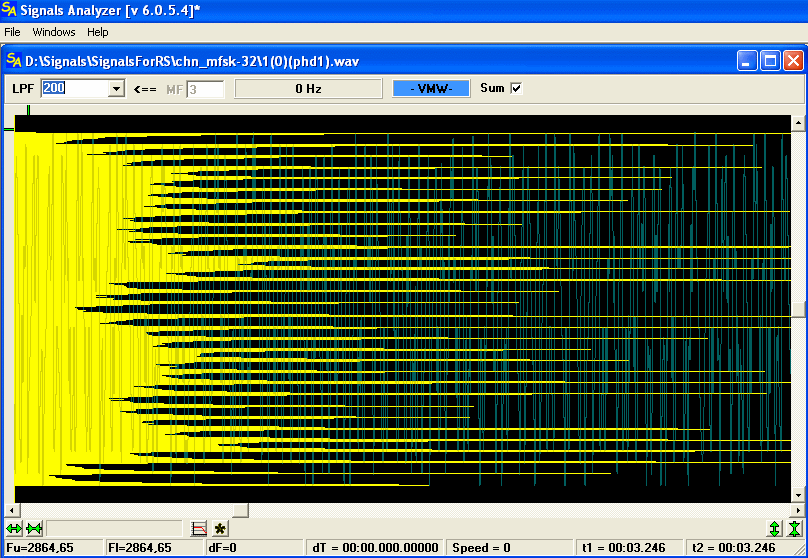
Signal WSPR by K1JT , it is indeed that case, when the declared presicion of measurements is fully realized.
Signal F7B-195.3 Bd 4-TONE British Military
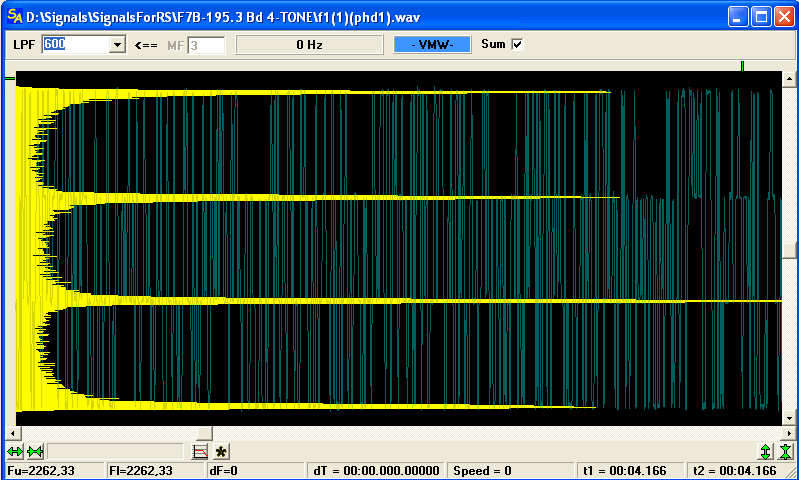
Attention please, it is nessesary to watch these videoclips and most of things will have become clear.
1. Videoclip to the first screenshot
2. Videoclip to the second screenshot
3. Videoclip to the thrid screenshot
This new mode, basically assumes further development, but these are future questions. It seems to us, that current implementation is more than adequate and take the place of extremely not fast AOF module, although we do not remove AOF module for some time. Probably further it will be liquidated, time will show.
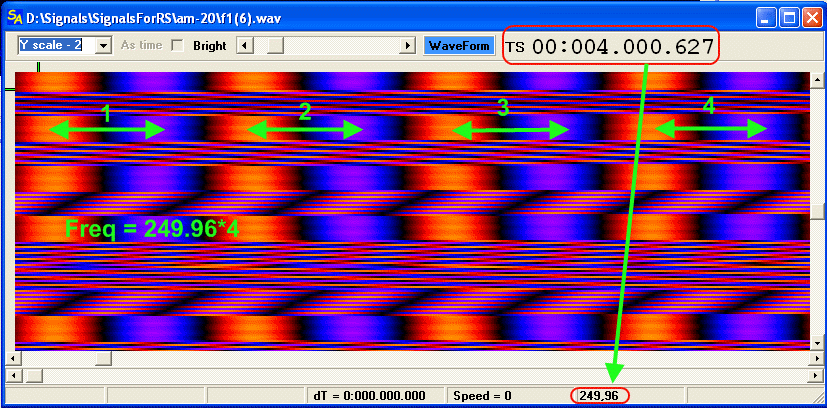
The second visible update addition, I underline visible (because internal solutions are vary very strongly) addition - is the displaying of the line's frequency, into that line the signal is spreading out in VMW. Sometimes it is convenient, especially for raster methods of studying of phase-manipulated signals.
Good luck!
|
|
|
|
Добавлять комментарии могут только зарегистрированные, активировавшие регистрацию и не ограниченные в доступе участники сайта!
|
| Файл создан: 25 Jul 2009 20:08, посл. исправление: 25 Jul 2009 20:18 |
|

